By: Leanne Armstrong
Quality decisions go a long way when it comes to running a successful project, department, or organization. And much like SWOT and cost benefit analyses, decision tree diagrams are an excellent addition to your decision-making toolkit.
In this decision tree analysis, we examine how using a simple diagram to visually represent different choices makes it easier to work through all your options and their most likely results.
What is a decision tree?
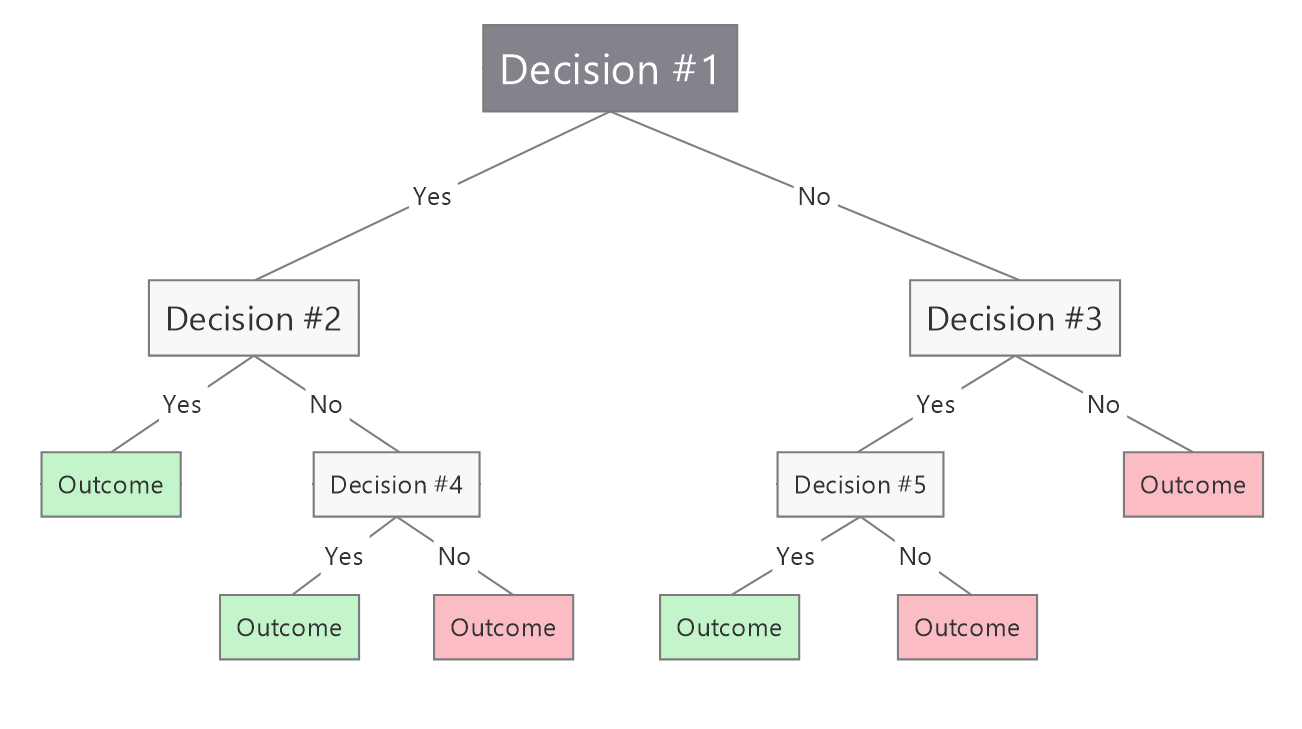
A decision tree is a visual map that shows two or more distinct decision pathways. Part flowchart, part cost-benefit evaluation, a decision tree diagram lays out the potential consequences of various solutions via a network of one-directional branches.
Although they’re a bit like other maps that help weigh different courses of action, decision trees are unique in that they:
- Demonstrate outcomes attached to a string of related choices
- Can be used to assign probability values to those outcomes
- Are especially useful in yes-or-no decisions and apples-to-oranges comparisons
One of the biggest advantages of using a decision tree template is that, unlike large blocks of text, it makes complex evaluations easier for everyone on your team to follow and understand.

How to use a decision tree
A decision tree is designed to explore possibilities by branching out from a single question or choice to every outcome that might unfold as the result of moving forward.
Because tree diagrams help drive team discussion AND determine best-choice scenarios mathematically, you can use them to:
- Bring structure to multiple options.
- Examine risks and rewards in equal measure.
- Predict the most favorable results through a combination of research, best guesses, and statistical probability.
If you woke up feeling exceptionally tired one morning, for example, and were debating taking the day off from work, that yes-or-no decision might come down to a simple matter of costs (loss of income or a valuable sick day) versus benefits (you get to roll over and go back to sleep).
But what if the decision were more complex than that?
- If you decided to stay home, would you feel compelled to get up and deal with personal or household chores instead?
- If you chose to go to work, would the likelihood of arriving late affect your decision? Would you feel too tired to be productive when you did arrive and regret going in?
Decision pathways often twist and turn with additional questions or criteria that must be probed for probability along the way.
By laying out decision points chronologically, a decision tree analysis lets you work through and compare the value and likelihood of different results.
Many workplace tasks flow better with the help of a decision tree. Examples include:
- Research analysis, strategic planning, and budget management
- Determination of product or market viability
- Computer programming and machine learning (where a decision tree classifier is frequently used)
Tree diagrams like the ones in MindManager do more than clarify problems and potential solutions. They also integrate seamlessly with other decision-making maps and are equally useful with or without hard data. And once you create one, you can easily update it with new information or calculations.
How to create a decision tree diagram
Laying out your decision-making steps visually makes it easier to see how each piece of information connects with another.
You can draw your tree diagram manually or digitally by using:
- Squares or rectangles to represent decisions
- Circles or ovals to represent uncertain results
- Blank spaces for completed outcomes
Here’s how to create a decision tree diagram in 4 easy steps.
Step #1:
Label a starting shape or node at the left side or center of your diagram with the decision to be made. Extend branch lines outward to represent each possible action, labeling them with keywords that explain their connection to your main decision.
Step #2:
At the end of each branch, add an appropriate shape or space and label it with a confirmed outcome, uncertain result, or new sub-decision.
Step #3:
For every new decision, branch out to possible actions. For every uncertain result, branch out to possible outcomes. Continue adding labeled branches and shapes until you’ve followed every option through to a completed outcome.
Step #4:
Calculate and enter the cost of each possible action and the value (or score) and probability of each possible outcome. To compare different options, multiply each outcome value by the probability that it will occur, add those results for each decision pathway, and subtract all the costs incurred along the way.
And that’s it!
Now you and your team can determine which solution holds the greatest value and maximize your chances of reaching a favorable outcome.
Example of a decision tree diagram
The easiest way to demonstrate how useful a decision tree template can be is to break one down as a simple, two-pronged choice.
Let’s say you need someone to take over your bookkeeping, so you can focus on growing your business. You’re not sure whether hiring a bookkeeper (your personal preference for maximizing immediate, face-to-face availability) or using an outside accounting service would be better, so you create a decision tree to help weigh your options.
First, you label a rectangle on the left side of your diagram and add branches representing your 2 courses of action:
Then, realizing that hiring a bookkeeper will mean nailing down work hours, you add another decision rectangle, along with final outcomes.
You’ve also heard through an entrepreneurial chat group that outsourcing accounting is a lot less work than hiring, managing, and potentially replacing a bookkeeper in-house.
So, you incorporate that uncertainty circle and final outcome into your diagram as well.
Next, you estimate and enter costs (from research), probabilities (from best guesses), and outcome values (based on how much each result would mean to you).
Finally, you analyze your results and draw three impactful conclusions:
- The best outcome in your opinion (hiring a full-time bookkeeper) is also the costliest
- The next-to-best outcomes (hiring part time and outsourcing) cost significantly less and are very close in value
- With outsourcing, there’s a very good chance you’ll save time and experience fewer headaches
Now that you can clearly see the costs, benefits, and probabilities involved, you decide that a reputable, virtual accounting firm is the best source of bookkeeping help for your business.
Decision tree use cases
Decision tree diagrams allow the individuals, teams, or companies using them to decide how much value they place on certain outcomes, and how much risk they’re willing to assume to achieve a specific result.
Here are three more decision tree examples that help demonstrate their versatility.
Company A wants to pump up their product offering
In the race to outpace an up-and-coming competitor, the company is debating whether to add a brand-new shampoo to their lineup, improve an existing product, or create a complementary conditioner. They build a decision tree to weigh product development and marketing costs against how long it’s likely to take to bring each new product to market.
Analyzing their diagram in conjunction with several other decision-making tools, the company ultimately decides to launch a conditioner.
Company B wants to choose between a business loan and line of credit
The company is having trouble managing cash flow and wants to gain access to additional working capital. Knowing loans and lines of credit come with different features and debt obligations, they lay all the data out in a dual-path decision tree to evaluate how likely each vehicle is to meet their needs.
The company determines that a line of credit will provide the kind of flexibility that’s important to them.
Company C wants to decide if it’s a good time to hire new staff
Business is booming, but the company is having trouble gauging the timing and affordability of onboarding additional salespeople. Their bookkeeper suggests using a yes-or-no decision tree diagram to help explore employment costs and expected ROI alongside the probability of new staff significantly impacting sales.
Having worked through the outcomes mathematically, the company decides to hire 2 new sales team members.
Remember, using visualization to explore information mimics the way our brains naturally work to analyze data. By starting with a single concept, and branching out to more specific details, MindManager’s visual decision tree diagrams bring key decision-making factors into crystal-clear focus.
Downloadable decision tree diagram templates from MindManager
Click the image below to access the decision tree diagram template shared above. Click “Menu” in the bottom left corner of your browser window, and then click “Download” to get a copy of the template. Open the template in MindManager to start working.
Don’t have MindManager? No worries! Try it free for 30 days.


