Considering how much of the world we experience visually, it’s a little odd how many project management tools and approaches don’t cater to our most prominent sense. Just because you read a task list or write yourself a reminder — technically making use of your ability to see — that doesn’t mean you’re using your memory, conceptual understanding, or ability to make dubious connections to their full potential. And that’s a shame, since a whopping 95% of information is perceived and translated by our eyes, making proper visualization of data and other information pretty crucial for success.
When it comes to project management and planning, employing visualization techniques can do wonders for surfacing information that might otherwise stay hidden, as well as allow you to see the big picture without missing important details.
The Visual Approach
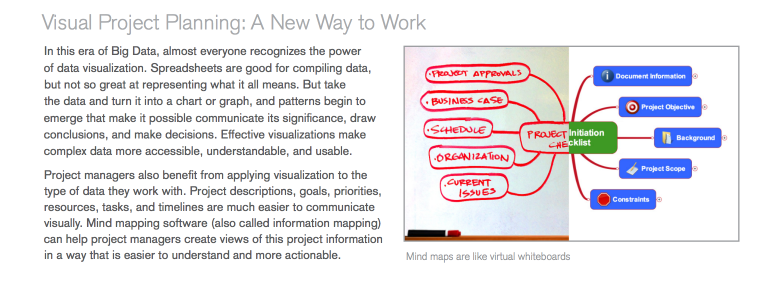
In our new whitepaper, you’ll learn how visualization can help you overcome many common project management challenges and pitfalls. Additionally, we make the case for mind maps, and how great they are for organizing project related information — everything from planning, to plotting, to execution and follow-up. From the research:
“In this era of Big Data, almost everyone recognizes the power of data visualization. Spreadsheets are good for compiling data, but not so great at representing what it all means. But take the data and turn it into a chart or graph, and patterns begin to emerge that make it possible communicate its significance, draw conclusions, and make decisions. Effective visualizations make complex data more accessible, understandable, and usable.”

Download this free whitepaper here. Or, to learn more about our Mindjet MindManager software, click here.

