An article by: Jörg Steiss, General Manager MindManager EMEA, Corel GmbH, Division Mindjet
The fourth and last part of this blog series is about dynamic data collection and processing, one of the most characteristic features of MindManager, particularly in contrast to other visualization software. Besides collecting and organizing data quickly in a visual medium, it is not only about representing information but also about working with the data and being able to bring it together in any context. In this chapter we will highlight again the pivotal possibilities of how to use MindManager as visual front-end to big data.
You can find other articles on “The Power of Visualization in the Digital World” here:
- The Power of Visualization in the Digital World: Part 1
- The Power of Visualization in the Digital World: Part 2
- The Power of Visualization in the Digital World: Part 3
Dynamically collecting and processing data
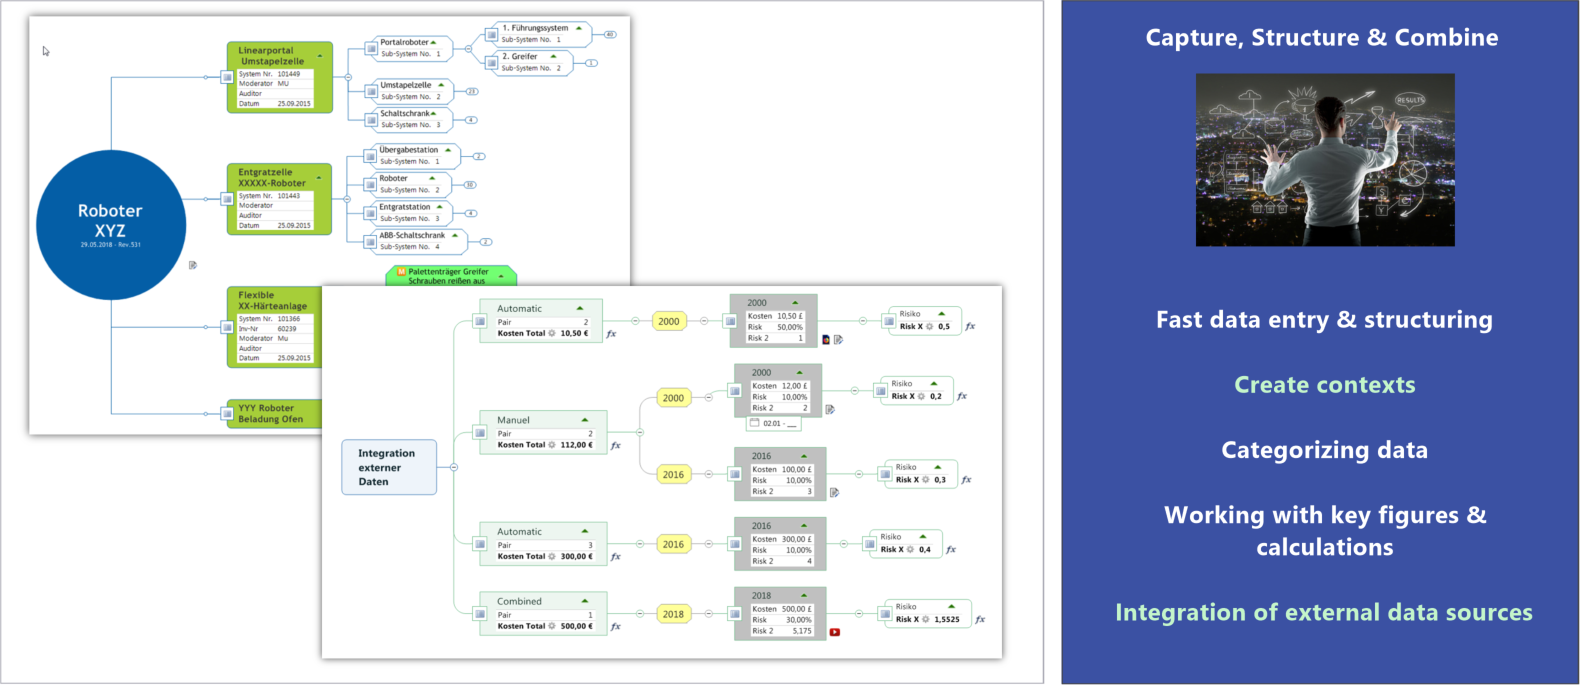 MindManager allows to capture and organize information in a very fast manner. It is flexible to how information can be combined. Simplicity and intuitive handling are paramount in supporting this central creation process in the most efficient way. Other tools, such as Post-its, whiteboards and the like, slow specifically this creative process down. It may be possible to quickly collect data with these methods, but structuring the data requires time-consuming rewriting or physically rearranging the notes. Time-consuming re-structuring not only limits the scenarios to elaborate on, but also hinders the creative flow.
Above all, working with data is associated with playing structural scenarios and elaborating additional details. This generates newer insights, additional details and/or new correlations or variations in the structure. Clearly identifying structures and details simplifies the identification of relationships, substantially supported by colors and images that highlight and show meanings and similarities. MindManager is often called a digital whiteboard by its users. Initially, it allows users to gather individual and dissociated pieces of information. Afterwards, the information is structured and restructured with drag and drop ease. Of course, this can also be done with entire substructures of a map.
Visual Front-end MindManager – Integrating external information
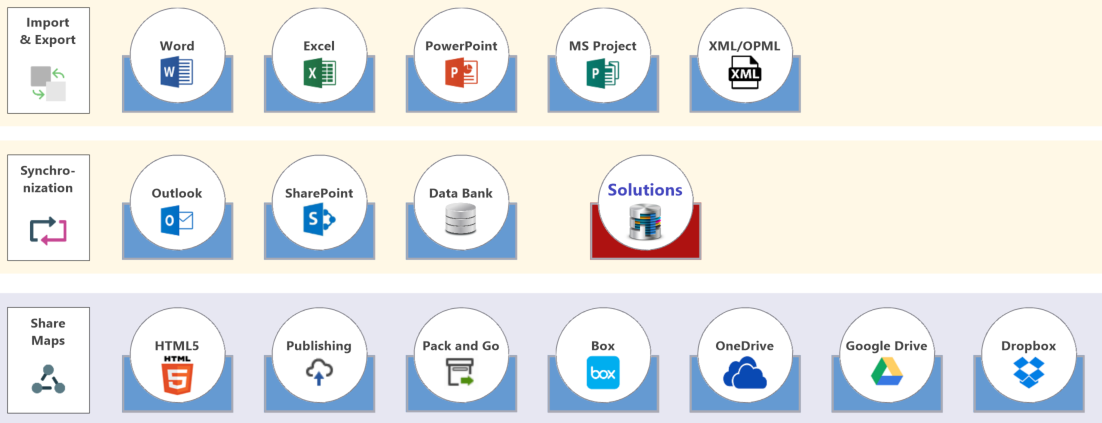
Knowledge work as part of Industry 4.0 and Big Data requires access to information stored in more complex systems such as databases. Other important information is contained in documents, e-mail inboxes, on websites or in MS SharePoint. In other words, in most cases the necessary information is available but scattered across a variety of sources of information so that a general overview of the information is lacking. In addition, today’s flood of information makes it difficult to identify and retrieve all relevant facts in the mass of information. Without the appropriate information and content, it is not possible to develop an extensive understanding or knowledge. Therefore, understanding the relations and connections of all pieces of information is an essential requirement for successful knowledge work and expert task fulfillment.
It is important to be able to put into context all necessary information from different sources. This should be done without having to transfer all information manually, which would be time-consuming, slow down the creative flow, and create redundancies. In the event of changes of the original information, the knowledge context is out of date. Permanent manual corrections would be necessary, which could require an enormous effort, especially if information is embedded in several contexts. Besides the manual overhead, this constitutes an enormous source of error because users forget to update all contexts or even don’t know all of them.
MindManager offers a way of linking topics with external documents, folders or website content. This enables the user to quickly find relevant information to a topic. However, this data is not yet visible in the context of the map. That is why MindManager is integrated with many other systems (including MS Office and SharePoint), which allows a fast aggregation of external information. The information is not simply linked, but the content is directly represented in the map. This enables the user to see and compare content from different sources in context and to more quickly identify cross-system correlations. Synchronization helps to avoid redundancies and ensures that you can keep embedded information up to date.
The following capabilities enable you to quickly gather and organize data and identify correlations across system boundaries:
- Fast aggregation of information from external sources
- Building any contexts and relationships
- Hypothesizing by playing with scenarios while considering all relevant information
- Up-to-datedness of data in maps as well as avoiding manual overhead and redundancies by synchronization
Integrations help avoid losing time by switching constantly between systems and applications, reduce the need to search for information and prevent from overlooking or forgetting facts. Integrating content into the map reveals correlations that are easily overlooked or quickly forgotten if you switch constantly between systems.
Example of an integration – analyses of machine data
Through the integrated XML and COM technology, MindManager offers further powerful connectivity to databases, which can be developed either internally by the companies or by technology partners. This allows to develop individual, query-based integrations to effectively visualize big data. But thanks to the flexible combination possibilities you can bring together a variety of data in a visual overall view and combine with other information. Along with analytic capabilities and the added value of visualization, you will have a fundamentally better understanding of data in order to make better and faster decisions and to take action.
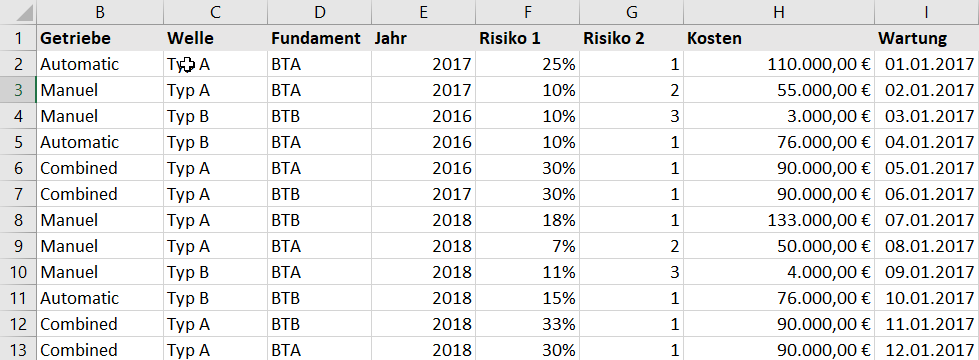
In the following we will describe a customer example that reflects this scenario. It can only be represented anonymously. The starting point were large Excel sheets (Figure 14 shows a greatly simplified example) with descriptions of industrial installations and machines, including key figures such as risks, error frequencies and maintenance costs. These Excel sheets consisted of hundreds if not thousands of lines and up to 300 columns. It should be noted that the scenario could also have been realized if the data had been stored in a database.
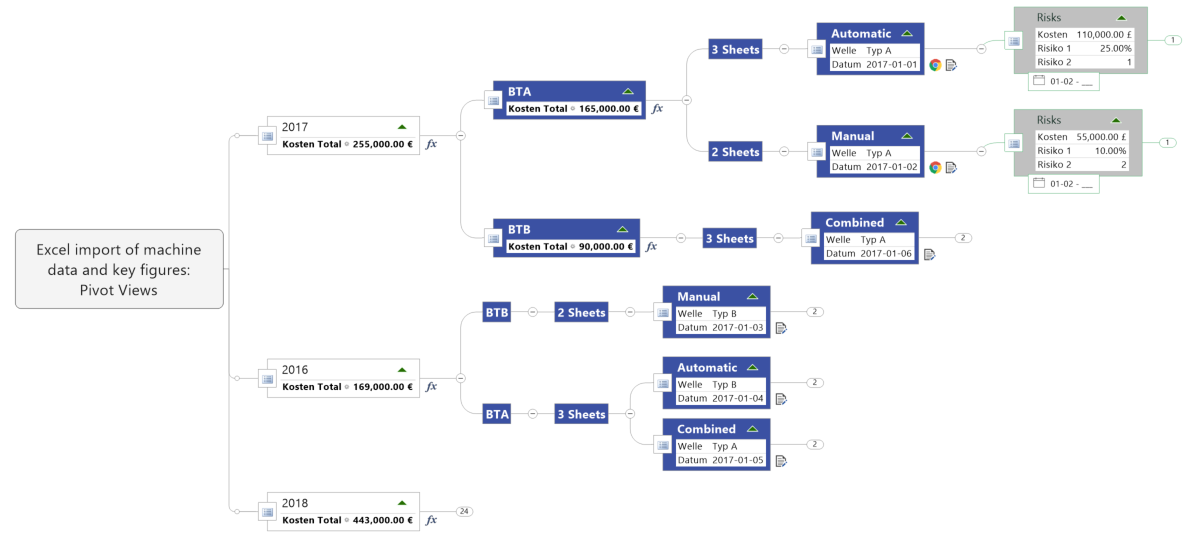
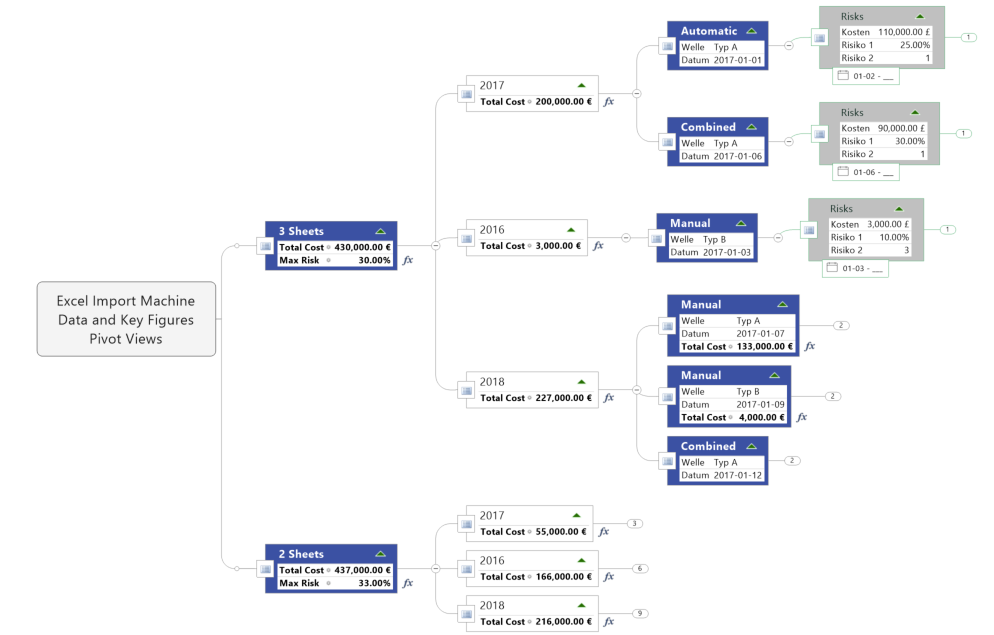
The problem was to create suitable analysis capabilities to uncover certain critical areas. Excel’s filter capabilities and pivot tables had reached their limits. A first approach consisted in trying to manually transfer certain structures into MindManager. The added value of visualization was quite clear. However, the manual effort was not justifiable. A solution was developed to automatically generate flexible pivot views in a map. It was possible to flexibly select what columns in which order were represented on the map. Furthermore, it was also possible to configure which key figures were represented in the topic properties. Building on that, calculations could be set up to provide additional analysis data.
This meant that it was possible to generate and compare completely different perspectives on the machine data — a great added value. Where necessary, additional calculations were integrated on an ad-hoc basis. Data can be enriched with priorities and other categorizations, as well as notes, tasks, links and much more information. Based on this solution, it was possible to evaluate data more quickly and with many more insights, while documenting the data and defining actions. Figures 15 and 16 show two example maps.
Try MindManager Today
Rely on MindManager to implement digital projects and processes in a visual, collaborative and smart way! Start our free 30-day trial.
About the author:
 Jörg Steiss is General Manager of MindManager EMEA at Corel, and as such he gets a deep insight in the newest digital technology trends in addition to his personal experience. Therefore, he places great emphasis on providing value to the customers in the development of the market-leading mind mapping software.

