An article by: Jörg Steiss, General Manager of MindManager EMEA, Corel GmbH, Division Mindjet
The world is changing rapidly, as demonstrated not only by the industrial change, from Industry 1.0 to Industry 4.0, but also currently by the so-called Industry 4.0 – Wave of Digitalization. This creates unprecedented possibilities to increase productivity by linking hitherto largely independent worlds.
Production, service and communications can benefit from sharing data and from using a common database. But there is also room for improvement in sales, marketing and direct customer approach, where totally new opportunities arise. For example, 3D printing already allows altogether different design and production possibilities – from sneakers to bridge construction.
Digitalization also leads to an exponential increase in the volume of data that is generated and becomes available. Therefore, one of the core issues of the digital future is how we can keep track of our data in this jungle and how we can find and understand relevant information in the context of a given task as easily and quickly as possible. The visualization of information and correlations can help considerably in this regard. Corel’s MindManager is a tool designed and tailored to meet these challenges. Its focus is on the contextual, dynamic and visual processing of data and on actively working with the visual format. Working actively–such as the integrated, automated allocation of tasks and follow-up tasks, as well as updating task status and databases–is based on the unique capability to synchronize the data visualized in MindManager with virtually all relevant data sources and software systems in the company.
Thus, visualization does not turn solely into a one-dimensional representation of a data point. As part of the daily work processes, it helps to simplify and improve understanding, overview and the next steps in projects, team work and when handling information. With its various visualization capabilities—from traditional mind maps, flowcharts, concept maps and timeline maps to 2 x 2 matrices—the new generation of MindManager shows that the appropriate form of visualization for the relevant task can maximize understanding, and communication between individuals and entire teams.
This not only delivers better results and higher productivity but also more fun and pleasure at work. Consequently, working with almost unmanageable amounts of data in the context of digitalization becomes a manageable challenge you can grow with, rather than being an insurmountable obstacle.
In the following paragraphs, we will show the basic concepts of how MindManager helps people in the context of Industry 4.0 or Digitalization 4.0 to make effective use of large data volumes in order to expedite and improve decision-making and to avoid risks and errors. Primarily, we will be looking at using MindManager as a visual front-end to big data.
MindManager as a visual front-end to “big data”

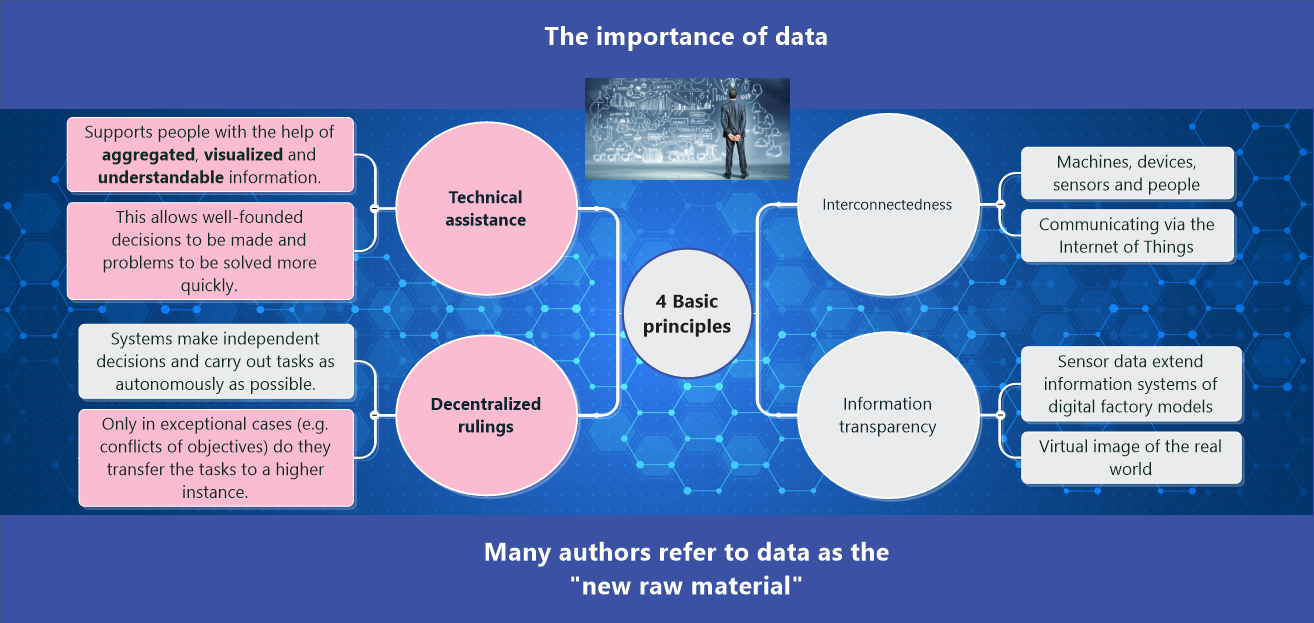
One of the main objectives of Digitalization 4.0 is connecting machines, devices, sensors and people in the so-called Internet of Things. Huge amounts of data will be gathered automatically—for example, with sensors that record the current status of certain machine components—to further analyze the data, bring it into relation and/or generate further derivations and conclusions, using AI-based approaches.
On this basis, machines can make independent decisions in a decentralized way, although humans can make decisions as a last resort in critical conflict situations. Furthermore, this processed data will be used to create technical assistance systems, helping humans to make better decisions based on better processed data.
However, as the availability of better processed data does not yet suffice, one is wondering how large volumes of data can be represented appropriately and how we can evaluate and use it efficiently and effectively. It is paramount to gain control of the complexity of the large amounts of data, and to be able to separate relevant information from unimportant information and to identify connections and interactions.
At this point, MindManager helps with three fundamental conceptual areas:
- Processing linked data visually helps to get a better overall view without losing sight of details (holistic view), as reflected in the saying “a picture is worth a thousand words.”
- Simple analysis capabilities and flexible switching of perspectives; it is here where the reduction of complexity plays a major role, as well as the possibility to focus on relevant data.
- Gathering and processing data dynamically is one of the most significant features of MindManager, particularly compared to other visualization software. Besides recording and organizing data quickly in a visual medium, it is not only about representing information but also about working with the data and being able to bring it together in any context.
Integrations play a major role in being able to use MindManager as a visual front-end and making it possible to transfer data automatically and not manually from other systems to MindManager. Besides standard integrations such as MS SharePoint, MindManager offers the possibility to implement dedicated solutions through its API (Application Programmer Interface).
These basic concepts will be discussed in detail in the next chapters.
Try MindManager Free Today
Rely on MindManager to implement digital projects and processes in a visual, collaborative and smart way! Start our free 30-day trial.
About the author:
 Jörg Steiss is General Manager of MindManager EMEA at Corel and, as such, he has deep insight in the newest digital technology trends, in addition to his personal experience. Therefore, he places great emphasis on the added value of the solution to the customers in the development of the market-leading mind mapping software.

