
By: Nicholas Mistretta
Have you ever heard that a picture is worth a thousand words? That sums up today’s topic: org charts. You can spend 20 minutes reading about the hierarchy or flow of information for an organization or project, or you can spend 10 seconds looking at a diagram. That’s what we call being efficient.
What are org charts?
An org chart, or organizational chart, is a diagram that is a graphical representation of a reporting structure or relational hierarchy that ranks its parts or positions. There are also matrix org charts and flat org charts, but for our purposes today, we’re going to mostly focus on hierarchical org charts as they are the most common and what most organizations need and use.
An org chart can outline the structure of a government, business, or organization or it can represent different elements of a field of knowledge. A hierarchical org chart uses a top-down approach, branching out the further down it goes. But in the simplest terms possible, it’s a way to structure hierarchical information in an easily digestible way.
Org charts are used for many reasons and they can be structured in many ways. You can use them to show the relationships of one individual to another, one department to another, or the various functions within an organization. Org charts can serve many purposes, from management tool to project planning to personnel directory.
How to use org charts?
Your company or organization can benefit in many ways from incorporating org charts. An organizational chart can:
Show reporting relationships or work responsibilities
- Help leaders manage others more efficiently
- Help employees have a better understanding of how their role fits into the broader organizational objectives
- Improve communication between various parties
- Create a visual representation of an employee directory
- Represent other types of information like a business entity or data hierarchy
An organizational chart also has five principal uses that overlap slightly with benefits listed above but may also add some context. These five principles uses are:
1. Used to show the management structure
You can use an org chart to see, at a glance, the management structure of an organization or other organizational structures like relationships between companies with common ownership groups.
2. Used to show other organizational structures
You can show use an organizational chart to show other hierarchies, such as business ownership structures.
3. Used as a planning tool
You can use org charts to plan and visualize a project or a company’s reorganization efforts.
4. Used as an employee reference
You can use an org chart as a reference for employees to help them understand who they report to, who reports to them, and their greater role within the larger organizational framework.
5. Used as an employee directory
You can use org charts for storing other information or as an employee directory, including names, telephone numbers, and email addresses.
What are the types of org charts?
There are four types of org charts:
- Hierarchal – functional top-down
- Divisional structure
- Matrix organizational chart
- Flat organizational chart
1. Hierarchal – functional top-down
This type of org chart is the most common kind and represents a traditional business structure. C-level executives go at the top, senior management is represented next, then middle management, and so on. These org charts are often divided into departments like sales, marketing, and IT. They show everyone’s role within the organization and all employees are grouped by their similar roles.
2. Divisional structure
A divisional organizational chart represents a business that is organized by product lines or geographical locations. Consider a company like General Motors and how they might create divisions based on each product type like sedans, sports cars, trucks, and SUVs. However, each division can also incorporate its own functional structure like sales and marketing. This type of org chart is used when divisions are independent of one another.
3. Matrix organizational chart
A matrix organizational chart reflects companies where you might divide employees into teams where each employee reports to two or more managers rather than just one. Each employee can have a primary manager but also a project manager that they work under. This type of org chart facilitates better communication and creates a more flexible work environment that is agile enough to change quickly, but it can also create some confusion.
4. Flat organizational chart
A flat organizational chart structure doesn’t show any (or few) levels of management between executives and other employees. It aims to empower self-management and it relies on proper decision-making capabilities for all employees. It’s most often used by smaller businesses, but even the occasional large company uses this type of org chart.
How to create org charts
Org charts are a great resource, as you can choose a type that works best for your situation and they can be tailored to your exact needs. There are many factors to consider when choosing a type of org chart. What type of information do you want to include? Should you use a hierarchical org chart or another type? And so forth.
Creating an org chart is not a difficult process once you decide on a structure. The basic steps are pretty universal, though much will depend on the org chart template you choose to use. You could create one by hand, but why waste time when you don’t need to?
Keep in mind that you’ll want to find a good org chart template that you can easily change or update, and we make a recommendation later in this article.
Org chart examples
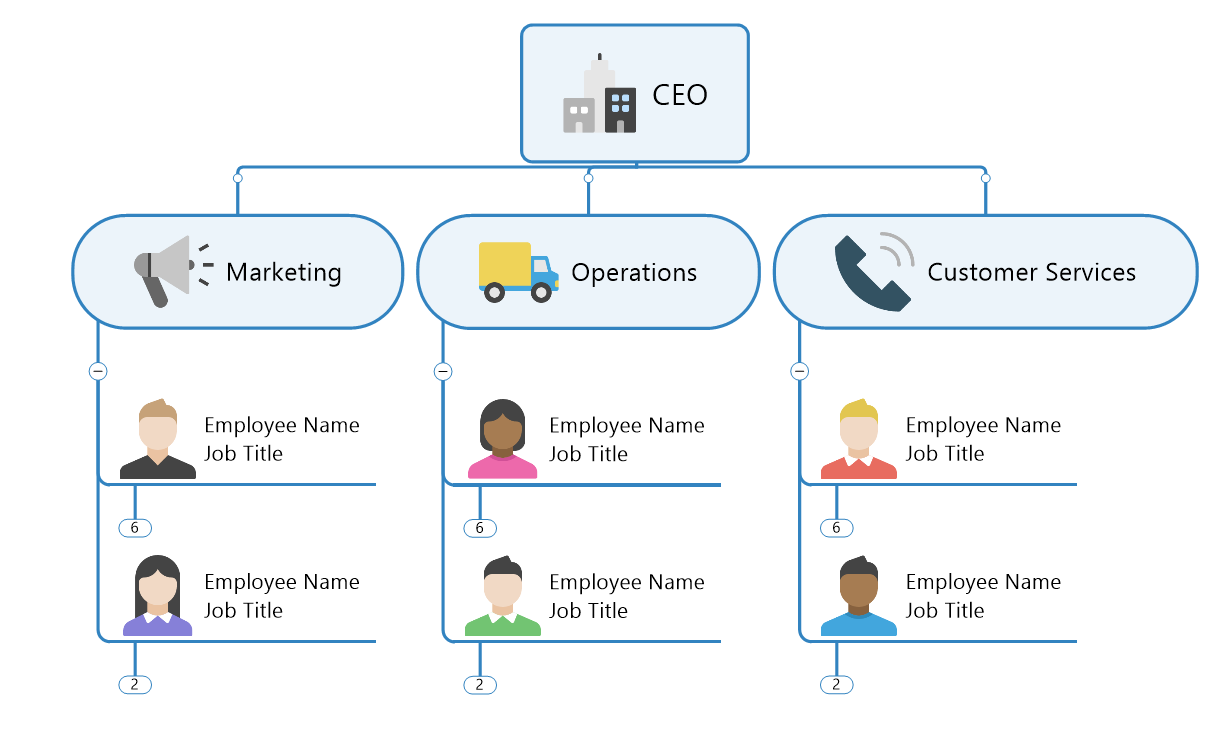
There are many org chart examples, but let’s use this simple example of an org chart for a marketing department.
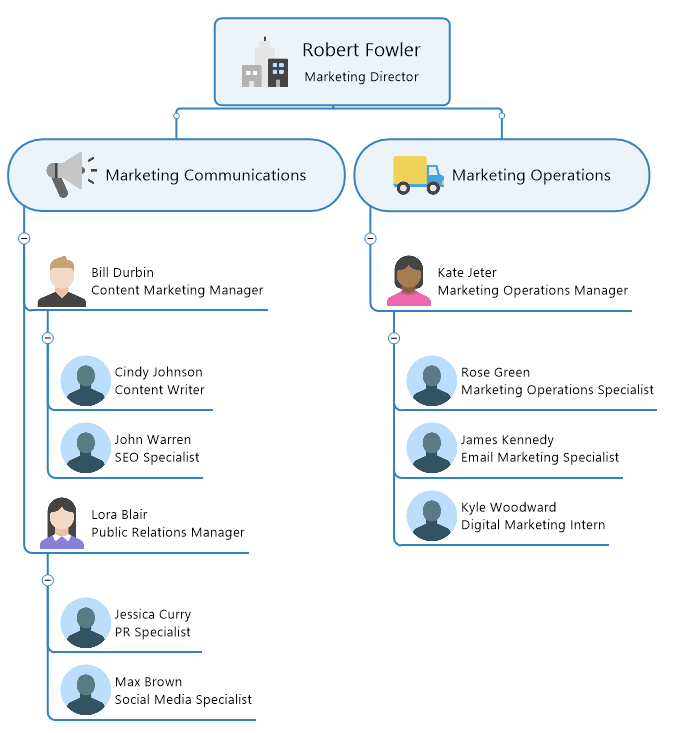
You can see in this top-down structure that the Director is on the top tier, and the managers are on the tier below that. Then you have the different staff members that report to each of the managers cascading below that. This also provides a quick snapshot of how the marketing department is structured into teams and sub-teams.
This piece of an org chart could then be slotted into a larger all-corporation org chart that includes the people and departments that the director reports into, and how those align with other teams at the company.
10 org chart tips for greater success
- Try to get your entire org chart on a single page. Use a combination of both horizontal and vertical arrangements of boxes to squeeze more onto a single page if possible – something you can print on a single page or view without scrolling.
- Group people with the same titles into a single box, rather than giving every person their own box. For instance, create a programmer’s box then list each programmer inside that one box.
- Create boxes that are the same size and have the same spacing between them. It will look better and be easier to understand at a single glance. Of course, if you’re using multi-person boxes like in tip two, this won’t be possible. Keep the spaces between boxes as small as possible to get more into a single page. If you’re using org chart software, it will likely do it for you.
- Use sidebars for manager assistants to distinguish the role as being different from the subordinates who report to the manager.
- Put the title first into each box and the name of the person in that role below. Job titles go above names to provide immediate context and to make the org chart more clearly understood quickly. Positions define the organizational structure, not the people in those positions. If you need to later, you can easily change those names, while keeping the structure intact.
- If a manager has two different titles, use two different boxes. If you’re using the tip above, you’ll be doing this automatically. In smaller companies, it’s common for one person to occupy two roles. John Smith might be the VP of Marketing and the VP of Sales but have different people working under him in each role. This is another good reason for organizing charts based on position and not by the person.
- Don’t get crazy with your use of dotted lines; use them sparingly. Use them only to show relationships that are unique, like if you have one assistant working for three managers. Too many dotted lines and your org chart will become a mess. If you find yourself in a situation where you need to use a lot of dotted lines, it may be better to create more than one org chart.
- Use a software program that can create your org chart automatically by importing data from a spreadsheet. Make sure you have a title column and a name column. This isn’t cheating but it is efficient and therefore smart. Excel or Google Spreadsheets will both do the trick.
- Create an online version of your organizational chart with hyperlinks that provide more information. While you may be printing your org chart, it’s still a good idea to send it to people within your organization online. You can also link several org charts together rather than creating one large and very complex chart. Which takes us to our last tip…
- Break up large complex charts into smaller, more easily digestible org charts. A large chart is cumbersome and difficult to view, which defeats the entire purpose of creating an org chart. And this is another good reason to have online versions; clicking through to another chart is much easier than fumbling around with multiple printed documents.
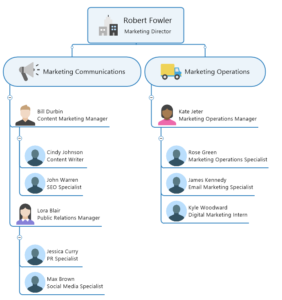
Downloadable org chart templates from MindManager
Click the images below to access the org chart example shared above, and a blank template created using MindManager. Click “Menu” in the bottom left corner of your browser window, and then click “Download” to get a copy of the template. Open the template in MindManager to start working.
Don’t have MindManager? No worries! Try it free for 30 days.