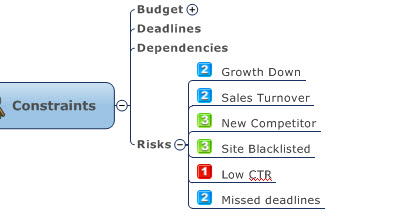
Imagine this classic scenario: You are heading up a team that’s been tasked with performing a risk analysis on a new marketing campaign. Your team has brainstormed what they think are the key risks for the program and entered them as topics into a map:
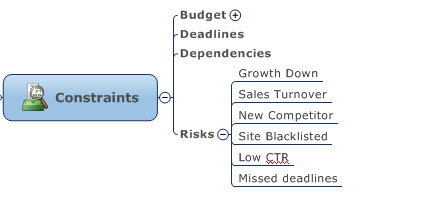
You want to evaluate which of these risks has both the greatest impact on the project and the highest chance of occurring. Is there an easy, fast way to accomplish this? MindManager 2012’s Analysis View.
Analysis View allows you to take topics from your map and place them in a relational two dimensional matrix. If you have ever used the four quadrant matrix popularized by Stephen Covey (Urgency vs. Importance) or use the Boston Consulting Group’s Market Growth vs. Relative Market Share matrix, then you could definitely benefit from using Analysis View.
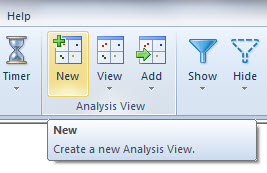
To get your team’s risks from the map into Analysis View, select all of the risks, then go to View, Analysis View and select New.
This opens up an Analysis window with the topics displayed in the Unsorted Topics list on the left.
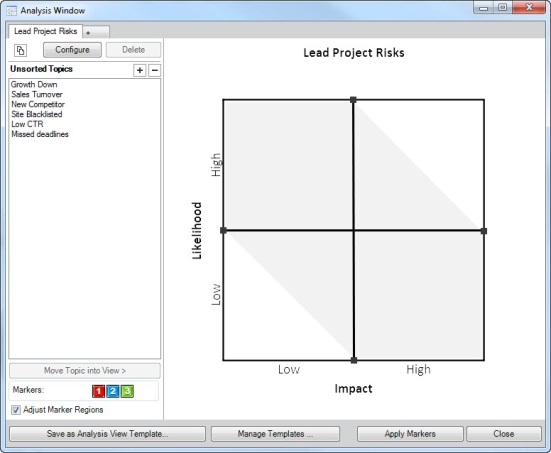
Then select the Configure button to configure the Analysis View to meet your requirements. (Included in MindManager 2012 are a set of nine predefined templates. If you can’t find a template, you can customize the view to meet your individual needs.) In the Configure menu select the Risk Analysis template and then type in a view name of Lead Project Risks and click on Done to apply it to the view. You can see the two main View types:
1. Segmented, which applies the diagonal bands you see in the image above to break the risks into three categories.
2. Quadrant, which would have no bands – allowing you to place the topics into one of the four quadrants in the matrix.
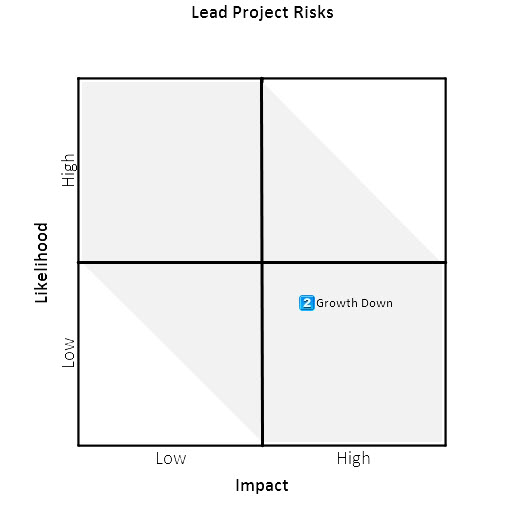
You can now move the topics from the unsorted list on the left to the view on the right. In the view below you can move the topic “Growth Down” from the list on the left by selecting it, and then clicking on the Move Topic Into View button at the bottom of the unsorted topics list.
You can click on the topic to move it around in the analysis matrix, until its position reflects the opinion of the team. Note that the axes are based on relative rankings (they run from low to high). The main purpose of moving the topics is to create a qualitative analysis of the relative position of each of the risks.
You can go ahead and add all of the other risks and then move them relative to each other.
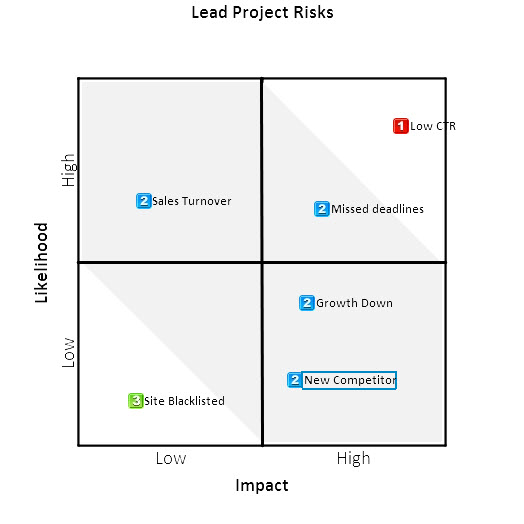
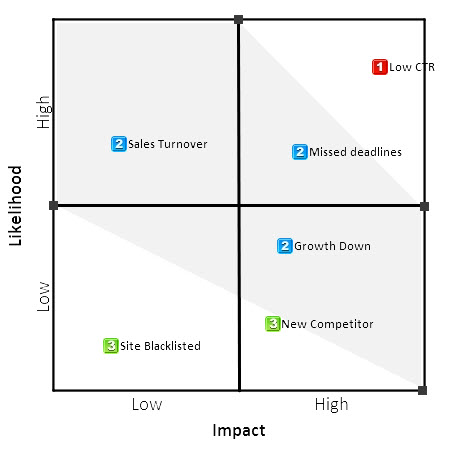
As you can see, depending on where the topics fall on the bands on the chart, they are assigned the priorities 1, 2 or 3. 1 represents the highest risks (high likelihood and high impact on the project), 2 is medium risk and 3 is low risk. The team can test the position of each topic against each other (i.e is the likelihood of missing a deadline higher or lower than that of a new competitor entering the market etc.). You can also adjust the bands to increase or decrease the area covered by the three bands. This is done by clicking on the Adjust Marker Region check box:
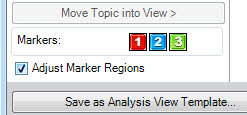
After checking the box, you then move the band markers to create the positions that you prefer.
You can also move the marker on the bottom axis over to the far right “high impact” end of the axis, changing the New Competitor topic from a priority 2 to a priority 3.
Finally, you can save this analysis view as a template (this is useful if you have customized it, and want to reuse it in the future). Then you can apply the markers back into my map, showing the results of my risk analysis.
This analysis view will be saved with the map, allowing you to document the relative ranking of the risks for the future. You can also use the Copy View to Clipboard button in the upper left hand corner to copy a bit map of the analysis view. You can then place that view in an email or in an electronic document.
There you have it! Some highlights of the powerful possibilities available in the new Analysis View.