By: Leanne Armstrong
Diagramming tools are a great way to organize your team and improve collaboration during brainstorming, plan creation, process analysis, or project management.
Swim lane diagrams in particular are more than an outstanding resource for illustrating connections between different ideas – they may be just what you need to streamline your next solo or group work assignment[/vc_column_text][/vc_column][/vc_row]
What is a swim lane diagram?
The most basic swim lane diagram definition describes it as a visual tool that excels at mapping out how a process flows from beginning to end.
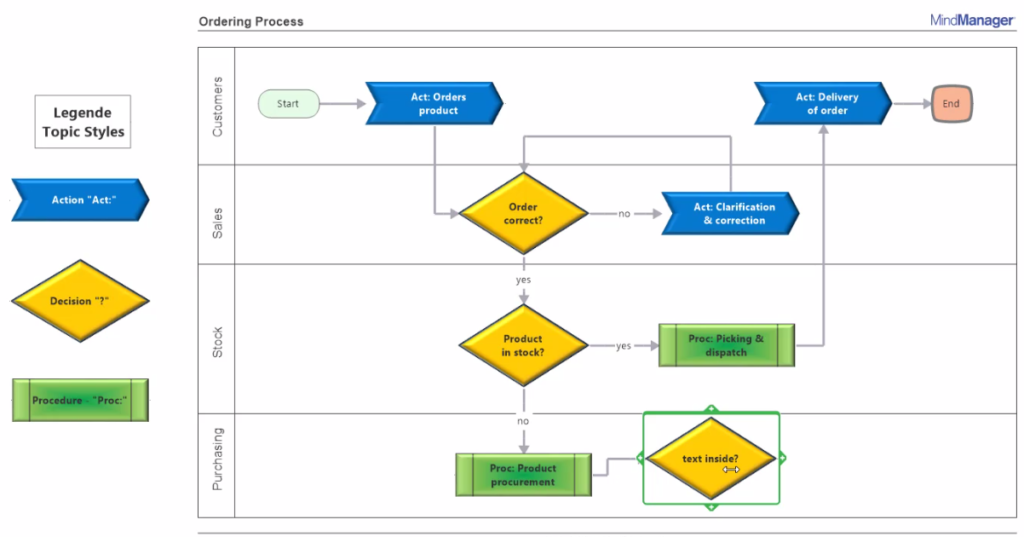
Essentially a cross-functional flowchart, a swim lane diagram breaks down the individual steps required to carry out certain work by detailing:
- What needs to be done
- Who’s going to be involved
- How intermittent and end goals will be met
What sets swim lanes apart from other flowcharts, however (and the reason they’re called what they are) is the way they lay out various tasks and objectives in side-by-side pathways or lanes.
This allows different employee or department responsibilities – or even distinct sub-processes – to be separated and viewed simultaneously.

How to use a swim lane diagram
There’s nothing quite like a visual diagram to clarify your thoughts and activities. Getting your processes down on paper in fact, can:
- Help free your team from distractions
- Make obstacles easier to explore
- Inspire plans to take shape, decisions to get made, and overall results to be enhanced
When it comes to putting swim lane diagrams to use in your personal work environment, the main thing to remember is that – because they’re such a great tool for laying out workflows, step-by-step – they’re especially well-suited to improving outcomes.
Swim lanes are particularly handy, for example, when you want to:
- Clarify accountability. More effective than other flowcharts for clearly defining what each department does and who holds responsibility, swim lane diagrams are ideal for sorting out process delays and bottlenecks faster.
- Troubleshoot problems. Using multiple swim lanes makes it easier to identify where issues lie and what’s causing them. You may, for example, discover communication blockages, workflow gaps, or task redundancies that can be corrected to make processes more effective.
- Increase efficiency. By arranging various data elements into specific categories and showing how they function, you can better see how efficient a process is and where improvements might be made.
Swim lane diagrams also work well for visualizing and comparing what happens inside different systems, plans, or work structures.
For example, you can use swim lanes to help contrast and evaluate:
- What other companies or markets are up to, as part of a competitive analysis
- Various marketing channels or methodologies you’re considering investing in
- Different designs for a new or improved product idea you’ve got in the tank
You might even decide to support your next company, department, or team change management initiative by using a swim lane diagram to track before and after performance outcomes.
Before we explore use cases like these in more detail, let’s find out just how easy it is to create your own swim lane diagram.
How to create a swim lane diagram
Like most maps, swim lane diagrams can be drawn on paper, whiteboards, or in programs like PowerPoint, Word, or Excel. But using digital diagramming tools, like the ones in MindManager, gives you far more versatility.
For a start, easy-to-use swim lane diagram templates allow multiple users to work in real time within the same drag-and-drop, interactive map. You can also gather and connect knowledge and data from other charts and diagrams, as well as from external sources.
Whichever method you choose, here’s how to create a swim lane diagram in 4 easy steps.
- Step #1: Categorize and label the areas requiring their own columns or lanes in your diagram.
- Step #2: Clarify your starting point and create an appropriately labeled bubble or node at the top (or one end) of each swim lane.
- Step #3: Add individual steps along each lane through to the end of your process, and explain what each represents in terms of your workflow. These steps can be sequential within the same lane, or can cross into other lanes.
- Step #4: Use lines and arrows to connect each step, clearly showing which way the chain of events – or transfer of information – flows in your process.
And that’s it!
Now that you know how easy it is to get started, let’s take a closer look at a simple swim lane diagram example.
Example of a swim lane diagram
Since swim lanes are often used to visualize events and roles that extend across different departments, we’ve created an example of a swim lane diagram template that could be used to troubleshoot and fix a product quality problem.
Let’s say your company manufactures and sells baseball bats, and profits have recently fallen off. It could be a sales or marketing problem. But you decide to start troubleshooting by creating a swim lane diagram that clarifies the roles of your purchasing and production departments.
Your finished diagram shows separate lanes for purchasing and production.
Key purchasing steps include:
Identify the need for raw materials > Create an RFQ (request for quote) > Negotiate pricing and terms > Issue a PO (purchase order) > Approve the supplier’s sales order
Key production steps include:
Maintain raw material inventory > Take delivery of production-related goods > Oversee the manufacturing process > Manage finished product stock levels
In addition to these in-lane directional lines, your diagram also includes cross-lane connections.
- Identify Material Needs < Maintain Material Inventory
- Approve Sales Order > Take Delivery of Goods
By meeting with your purchasing and production teams to explore these two connections first, you make a significant discovery.
The last time production asked purchasing to secure more raw materials (i.e., the wood for your bats):
- Your company’s usual supplier of ash wood was unable to fulfill the request
- Purchasing issued an RFQ to several new vendors
- A maple wood supplier was the timeliest and most cost-effective option
Given that ash and maple are both hardwoods, purchasing ok’d the sales transaction, production accepted the shipment, and a new batch of baseball bats soon rolled off the line.
What neither department realized however, is that because maple bats are more prone to breakage than ash bats, customers had recently been returning your product.
Fortunately, thanks to your swim lane diagram, you were able to identify the problem, clarify requirements between departments, and prevent this quality issue from recurring in future.
Swim lane diagram use cases
Visualization is a powerful way for teams to identify and understand problems, opportunities, priorities, and goals. And as a highly visual planning, analysis, and improvement tool, swim lane diagrams serve multiple uses.
For example, they can help your team:
- Integrate new ideas to optimize an established workflow
- Define requirements and objectives for the process or product you need to design
- Play out and evaluate alternative procedures
Hopefully, the swim lane diagram example above has given you some idea of how this tool might improve your own team’s processes. But to keep the creative juices flowing, here are a few more swim lane diagram use cases.
Company A wants to cut costs in their accounting department.
The company uses swim lanes to lay out their bookkeeping sub-processes (accounts receivable, accounts payable, collections, and payroll) and identifies 3 key areas where certain tasks can be automated: invoice generation, bill payments, and receipt and expense management.
Implementing dedicated tech tools in these areas eventually saves the company 6 hours of manual labor per week, for an annual cost savings of $6,000.
Company B wants to improve their customer service outcomes.
After meeting with customer service personnel, the company determines that while their reps are both experienced and conscientious, their methods for dealing with client issues vary widely. Using a swim lane diagram, they compare several designs for standardizing the customer resolution process, settle on the most promising series of steps, document it, and put it to work.
Customer satisfaction surveys and net promoter scores soon indicate that normalizing their customer problem-solving process has positively impacted outcomes.
Company C wants to make their sales process more efficient.
Determined to help their sales reps become more productive, the company uses a simple flowchart to take a closer look at their sales process. Finding nothing conclusive to work with, they next use a swim lane diagram to see how their marketing and sales departments work together and are startled to discover that both areas have been taking responsibility for qualifying new leads.
The company advises their sales department to remove this redundant step from their sales cycle and CRM data subsequently reveals a productivity up-tick over the next two quarters.
In addition to high-level use cases like these, don’t forget that you can also take advantage of MindManager’s intuitive swim lane diagrams in smaller or individual pursuits – from improving meeting efficiency, to streamlining your daily workflow.
Downloadable swim lane templates from MindManager
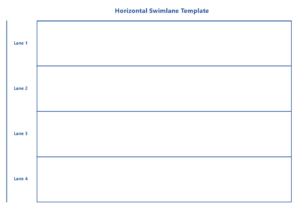
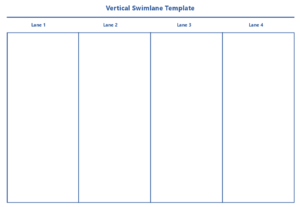
Click the images below to access Hhorizontal and vertical swimlane diagram template created using MindManager. Click “Menu” in the bottom left corner of your browser window, and then click “Download” to get a copy of the template. Open the template in MindManager to start working with the template.
Don’t have MindManager? No worries! Try it free for 30 days.


