By: Leanna Armstrong
Figuring out what lies at the root of a complicated production or work process challenge is sometimes easier said than done. Fortunately, a cause and effect diagram makes for a handy tool any time you’re called on to solve a problem or prevent one from happening.
What is a cause and effect diagram?
A cause and effect diagram is a visual map that functions as a problem-solving tool. As the name suggests, its main purpose is to help you identify the cause of a troubling situation in relation to the effect (or results) you’ve observed.
To clarify the cause and effect diagram definition further, it may help to understand that this tool is also known as a fishbone diagram. By setting your problem on one side – and radiating out to the various elements that may be causing it on the other – you end up with a diagram loosely resembling the skeleton of a fish.
How to use a cause and effect diagram
If you’re in any way involved in manufacturing or selling a product or service, chances are you can benefit from using a cause and effect diagram tool.
Fishbone diagrams are designed to help you:
- Get clear on the nature of a problem and why it’s occurring
- Identify contributing factors and how they’re connected
- Determine the best course of action for correcting a setback
You’ll get more from your cause and effect diagram if you and your team use it while brainstorming which areas of a particular process are most likely involved.
By visually breaking those areas down into their various components – and noting the impact of specific activities – you can increase your understanding of where things have gone wrong, and find a solution much faster.
You may discover, for example, that you need to:
- Change out materials or suppliers
- Revise the steps in a new or established workflow
- Tweak the tasks carried out by certain departments or individuals
With that in mind, here are 3 key areas where fishbone diagrams are commonly used.
1. Manufacturing a product.
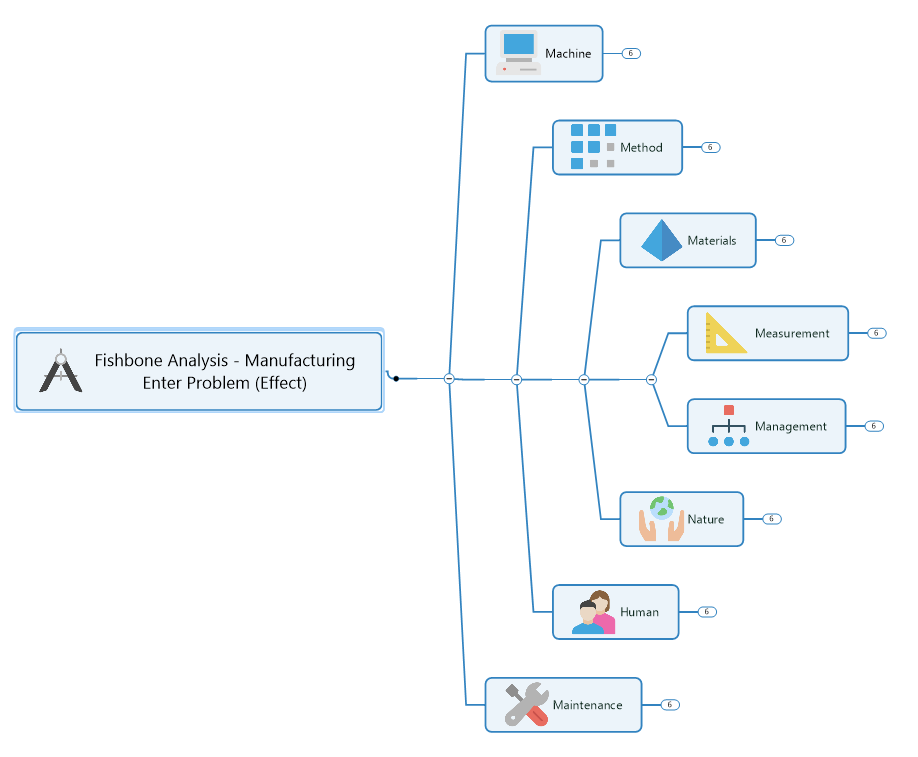
This usually includes analyzing the 6 (or 8) M-factors involved in most production processes (Machinery, Method, Materials, Measurement, Mother Nature, Manpower, Management, Maintenance).
2. Providing a service.
This may include examining the 4 S-factors involved in many service delivery procedures (Surroundings, Suppliers, Skills, Systems).
3. Marketing a product or service.
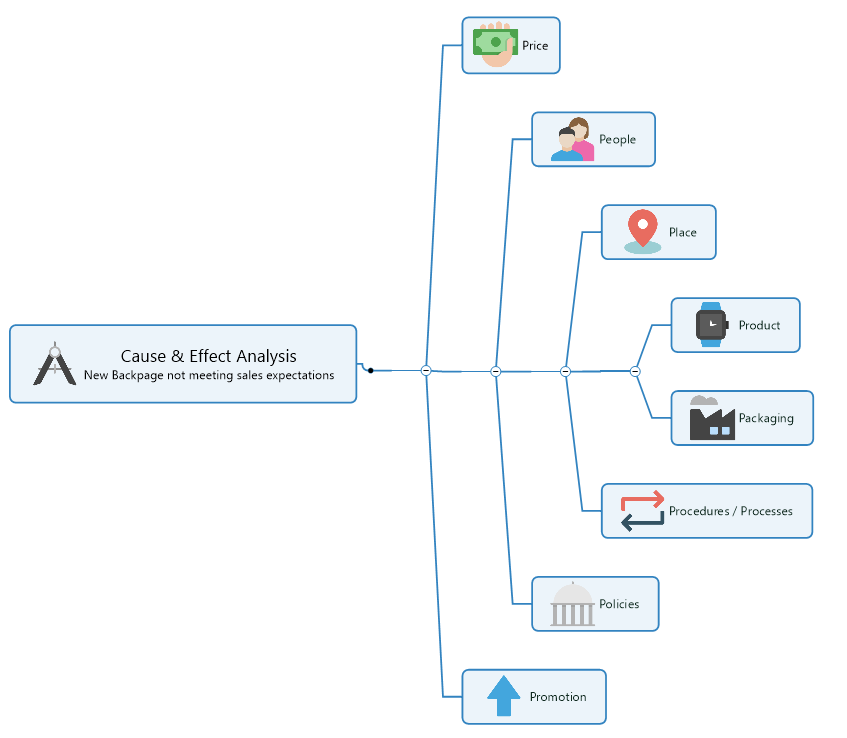
This may include exploring the 8 P-factors involved in many product or service marketing systems (Price, People, Place, Product, Packaging, Procedures/Processes, Policies, Promotion).
No matter the source of your predicament, creating a cause and effect diagram template will help you and your team drill down and sort out the changes required to put it right.
How to create a cause and effect diagram
With a versatile program like MindManager, you can use a fishbone diagram template to capture, view, and organize all the potential causes of a problem – then use (and link to) an idea map for brainstorming ways to resolve it.
Here’s how to create a cause and effect diagram in 4 easy steps.
Step #1:
Label a box or node at one end of your diagram with the name of your issue (this represents the “head” of your fish).
Step #2:
Extend a main “spine” line from this node out to one side.
Step #3:
Add “rib” lines that branch off from either side of your main line, each leading to its own node. Label these nodes with the names of areas or factors that may be contributing to your problem.
Step #4:
Break down and explore each of these potential causes further by branching off to the specific processes, tasks, or resources involved (these are your sub-causes).
And that’s it!
Now, you and your team can spot suspect activity and identify the areas that are most likely causing your issue more easily. To better focus on problem-solving, you might even prioritize these factors by ranking them in the order in which they should be addressed.
Example of a cause and effect diagram
Creating a fishbone diagram is a great way to see what’s behind a particular problem so you can both resolve it and prevent it from occurring again. Here’s a simple cause and effect diagram example to help demonstrate this.
Let’s say you want to build out your line of travel backpacks and have recently launched a second product. Despite the success of your original backpack however, your new, sturdier pack is falling short of sales expectations.
You decide to investigate the problem from a marketing perspective with the help of a cause and effect diagram.
First, you identify the problem at hand by labeling a box on the middle left side of your diagram:

Next, at a loss for where to actually start, you construct the skeleton of your diagram by adding a spine line and branching out to all 8 areas of your marketing process:
At this point, you realize you should probably sit down with your promotional team and examine the key factors affecting these categories.
After some inspired brainstorming, the ribs of your diagram look like this:
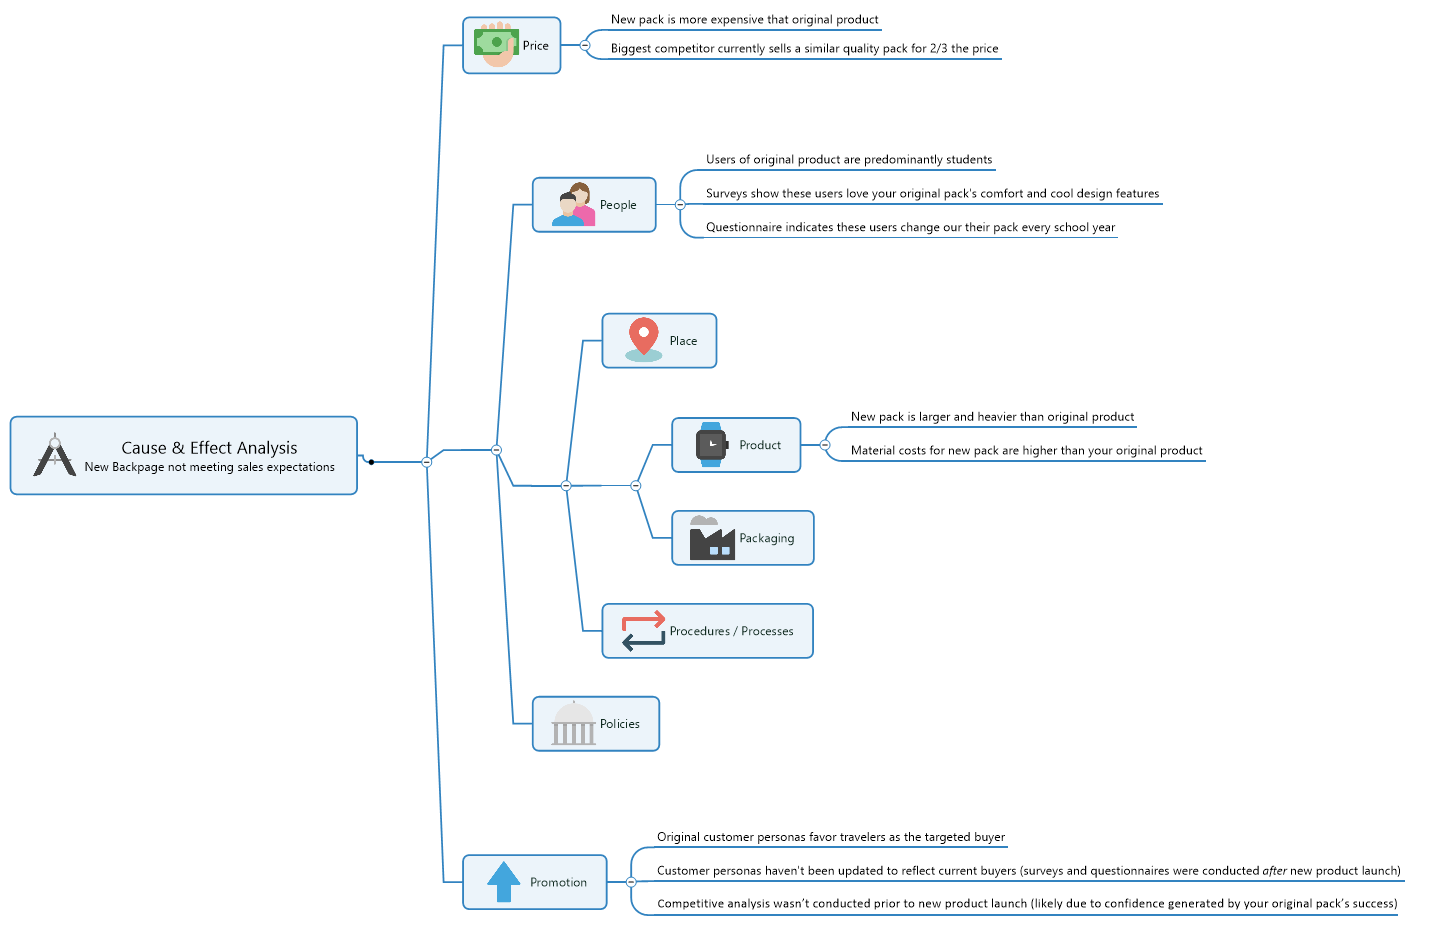
As your team sits back and analyzes their finished diagram, 2 key findings emerge:
- Instead of travelers, your existing customers are predominantly students who love your product but can’t afford – and don’t want or need – a larger, heavier, more expensive version
- The travelers your new product was geared toward can buy a similar quality pack for significantly less from your local competitor
Now that you have a better understanding of the reasons behind your new pack’s lack of success, you can create a plan to resolve the problem (possibly by sourcing less costly materials) and ensure you always perform sufficient marketing research in future.
Cause and effect diagram use cases
Crafting a simple cause and effect diagram template is the best way to shift your team’s focus from the symptoms associated with a problem, to the construction of a practical plan for meeting it head-on.
Here are some simple use cases that illustrate a few more common cause and effect diagram examples.
Company A wants to fix a product quality problem
Production quality at the company’s newest widget manufacturing facility is below that of other locations. After ruling out factors in common, the QC team meets to create a cause and effect diagram around two key areas – Mother Nature (environment) and Manpower (plant workers) – and makes some impactful discoveries: the new plant is located in a very humid location where skilled labor is limited.
Making process adjustments to correct for the humidity and ramping up training allows the company to normalize quality.
Company B wants to resolve an image setback
As a newer massage and body treatment spa, image is especially important to the company. After a promising start, however, customer reviews show their reputation for calm and relaxation has taken a hit. Management sits down to brainstorm the problem and, with the help of a fishbone diagram, resolves that recent renovations and staff turnover have combined to disrupt the spa’s serene surroundings.
The company makes a plan to both confine renos to off-days and improve employee engagement.
Company C wants to overcome a marketing challenge
With a full line of successful breakfast cereals under their belt, the company is at a loss as to why their latest cereal isn’t selling. Working with their marketing department, they use a cause and effect diagram tool to pinpoint the problem and conclude that the only real difference lies in the packaging.
The company creates several new packaging designs and polls their target audience to determine which holds the greatest appeal.
Remember, mapping your way out of a problem is the easiest way to see where you are, how you got there, and what the most promising route is to get back on track.
Downloadable cause and effect diagram templates from MindManager
Click the images below to access the cause and effect diagram example shared above, and a blank template created using MindManager. Click “Menu” in the bottom left corner of your browser window, and then click “Download” to get a copy of the template. Open the template in MindManager to start working.
Don’t have MindManager? No worries! Try it free for 30 days.
