When implementing a complicated project, it’s easy to get lost in the details—especially if there are multiple teams, different deadlines, and tons of resources to keep organized.
What if, instead of juggling a long list of tasks and dozens of messages, your project was displayed in a colorful, interactive road map with tasks, milestones, and charts?
How much easier would it be to get work done if you could see the project progress at a glance?
It’s possible with visual project management tools.
The shift toward visual project management tools is transforming how teams plan, execute, and track projects. This article explores visual project management and how it can improve project success.
Learn how MindManager® helps teams plan and execute projects in a visual environment. Try it free today!
What is visual project management, and why is it important?
Visual project management is an organizational concept that combines project management tools with the benefits of data visualization.
It often leverages visual tools like Gantt charts, Kanban boards, flow charts, timelines, and mind maps.
Traditional project management focuses on tracking tasks and staying organized using text and lists.
Visual project management uses icons, colors, charts, and graphs to combine task management’s benefits with data visualization’s power.
But why does this concept matter? Is visual project management just another business buzzword to be forgotten in a few months?
Visual project management matters because humans are visual creatures. Nearly half of human brains are dedicated to processing visual cues, making visual charts an ideal format for project management.
Another reason visual project management is functional comes down to distractions.
Think about how many pings, messages, and emails you get daily. It can get overwhelming.
With visual project management tools, a quick glance can tell you a project’s progress and where to focus your efforts.
5 examples of visual task management tools
Visual project management systems provide an intuitive way to track progress, prioritize tasks, and collaborate more effectively.
While various tools exist, different formats tend to work better for specific project types.
Let’s explore a few of the most popular visual project management systems and when to use them.
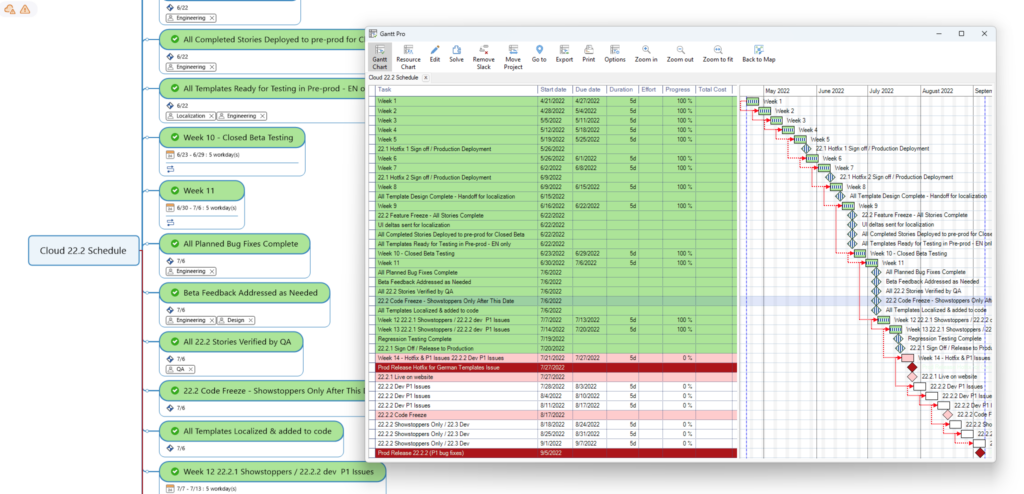
1. Gantt charts
Gantt charts use a grid format to display tasks and events in a specific time frame. The X-axis features the timeline, which can be expanded or contracted, while the Y-axis shows particular tasks or activities to be completed.
Gantt charts often feature data analytics about the project through stats, charts, or graphs.
When to use Gantt charts: For time-sensitive projects, especially those that are more complex or long-term.
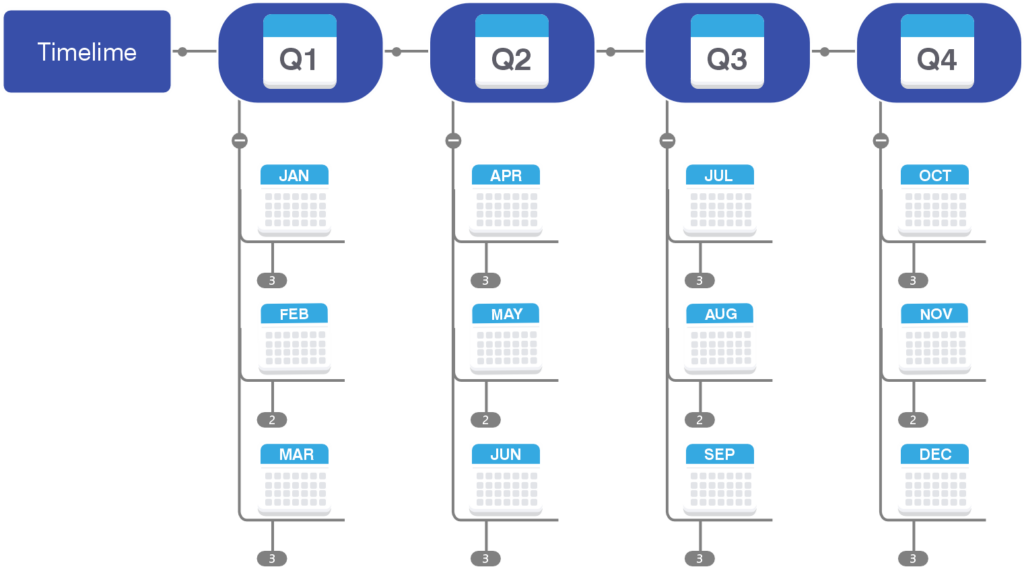
2. Timelines
Timelines are visual project management tools for tracking events in chronological order. They often include historical events as well as future events.
One key benefit of timelines is breaking complex tasks into smaller, more manageable steps.
Timelines are helpful when time tracking is a concern or when tracking a long-term project.
When to use timelines: For time-sensitive projects, especially those that are long-term or rely on historical data.
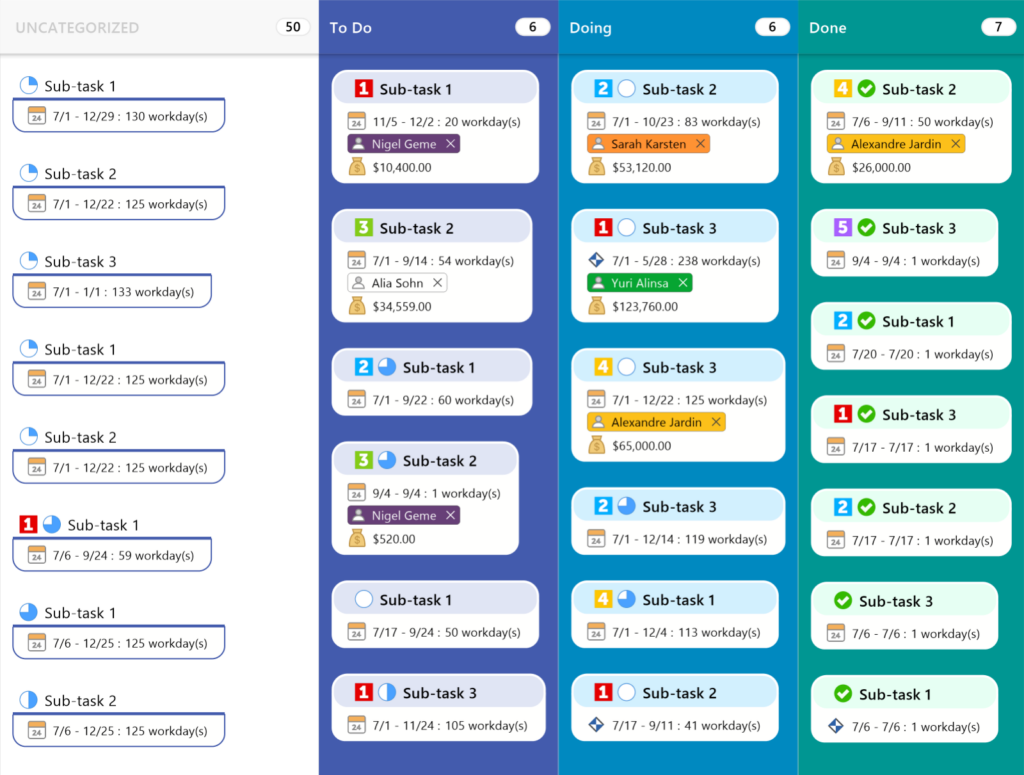
3. Kanban and Scrum boards
Kanban boards are a task management tool that helps visualize the workflow with “cards” organized into columns based on their status—such as “on hold,” “high priority,” or “in progress.”
Due to their easy-to-use format, Kanban and Scrum boards are particularly popular with Scrum and Agile teams. Users can simply drag the card to a new column when a task’s status changes.
When to use Kanban and Scrum boards: They are ideal for process-based projects such as content calendars, QA processes, coding, or customer success.
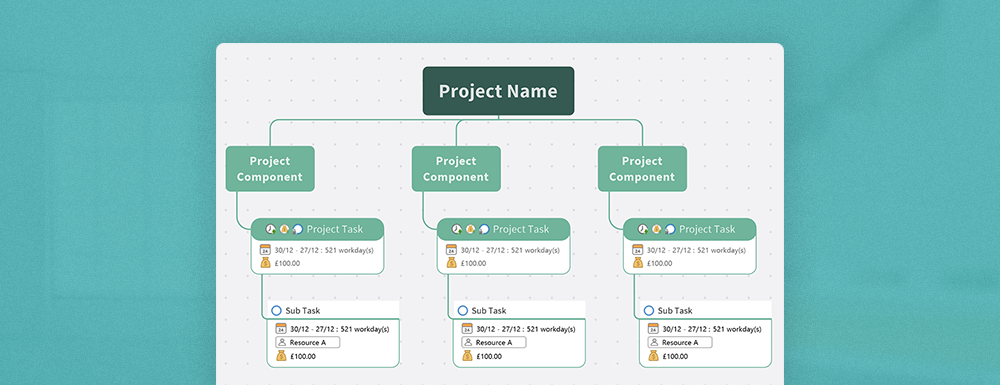
4. Mind maps
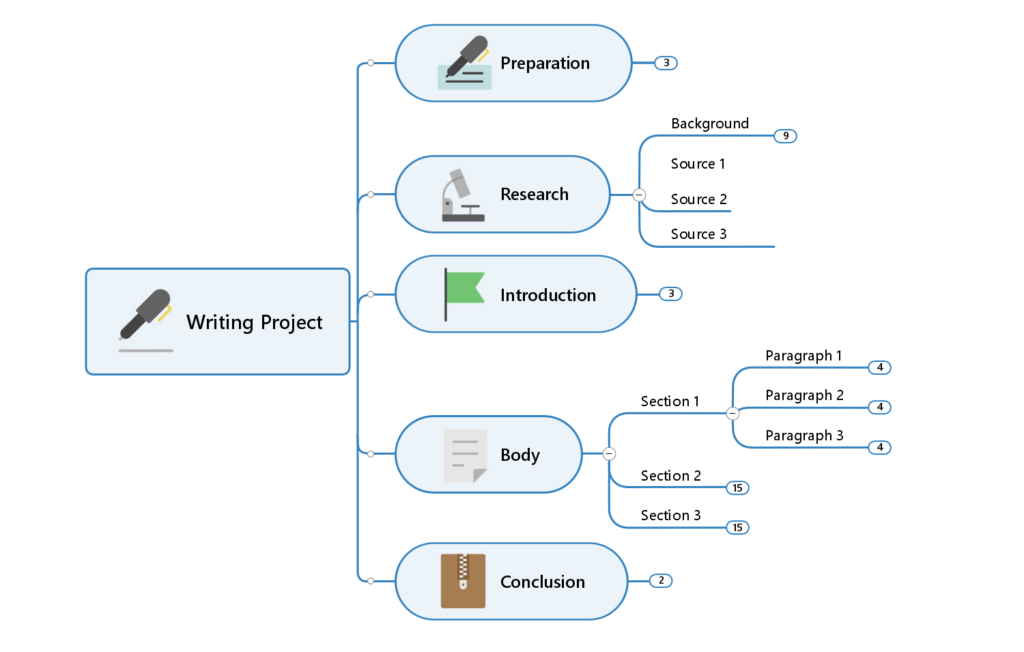
Mind maps are visual diagrams that organize concepts based on how they relate.
They include a few primary concepts that are connected to sub-concepts via a line. They are similar to a spoke and wheel — however, they can get much more complicated, like this:
When to use mind maps: For complex or multiple processes that run simultaneously. For example, to track a product launch that includes tasks and projects across multiple teams.
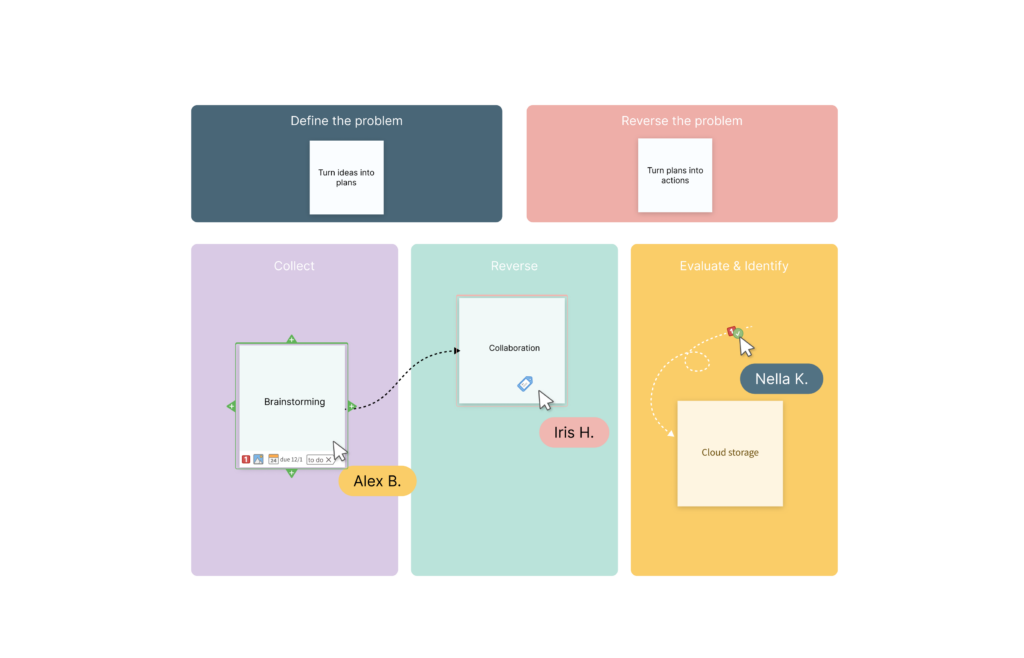
5. Whiteboards
Whiteboarding templates are fully customizable digital whiteboards. Users can add shapes and sticky notes, add images, upload documents, and even integrate other tools like Zapier or Jira.
Their customizable nature allows your team to create a visual project management process that works for you — rather than shoehorning your process into another format.
When to use whiteboards: Anytime other visual task tracking formats don’t work for your team and the way you work.
What are the benefits of visual project management?
Most teams love visual project management tools because they are easy to use. You can easily see where a project stands, what needs to be done next, and spot bottlenecks.
They are also collaboration tools that can be used to update senior leadership and serve as a roadmap for project success. Here are a few more benefits your team will enjoy.
Save time
Visual charts such as Kanban boards and Gantt charts make it easier to see a project’s progress, track resource allocations, and spot bottlenecks in a process. This means less time managing a project and more time getting things done.
Increase productivity
By providing a structured and visual framework for managing projects, visual project management helps streamline workflows and reduce confusion. This increases productivity and allows team members to focus more on delivering results.
Improve collaboration
Visual project management tools are shared, allowing everyone on the team (including leadership) to collaborate in real-time, share updates, and prioritize tasks more effectively. When teams collaborate more effectively, projects are completed faster and are more likely to succeed.
The future of project management is visual
Visual project management provides an accessible way for teams to plan, track, and manage projects. This helps streamline workflows, improve collaboration, and increase the likelihood of project success.
Ready to take your project management to the next level? Try MindManager for free.