When something goes wrong, it’s essential to understand the root cause in order to prevent it from occurring again.
However, life and business are both complex, making it difficult to identify at times the underlying causes which created the situation you’re facing now. That’s where and when a fishbone diagram can help!
In this article, we’ll dive into everything you need to know about fishbone diagrams and how to use them for problem-solving.
What is a fishbone diagram?
Fishbone diagrams (also called Ishikawa diagrams and cause-and-effect diagrams) are visualizations used to identify and illustrate the causes for a specific event. Potential causes are often brainstormed and then categorized in order to identify a problem’s root cause.
The diagram gets its name due to the branches radiating out from the main issue in a way that resembles a side view of a fish skeleton. However, the process can be applied to most mind map layouts.
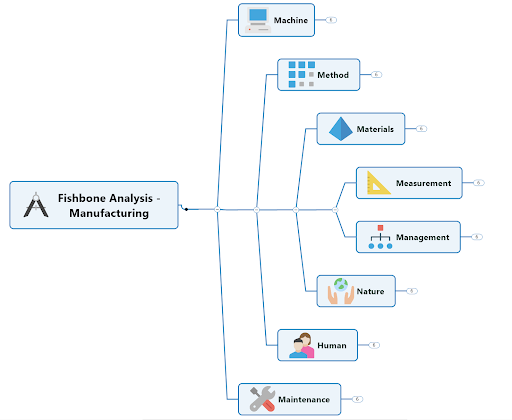
Here’s a fishbone diagram example:

When to use fishbone diagrams
Fishbone diagrams help focus you and your team’s energy on the root cause of a problem instead of merely addressing and wasting time on the symptoms.
Here are a few common applications of Fishbone diagrams:
Manufacturing: Discover the root cause of a manufacturing issue by brainstorming and ranking the likelihood and impact of all the areas that influence the production process.
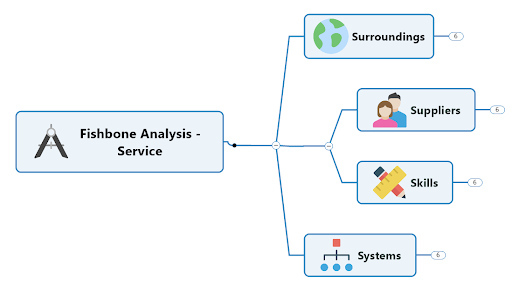
 Service: Discover the root cause of a service issue by brainstorming and ranking the likelihood and impact of all the areas that influence the service delivery process.
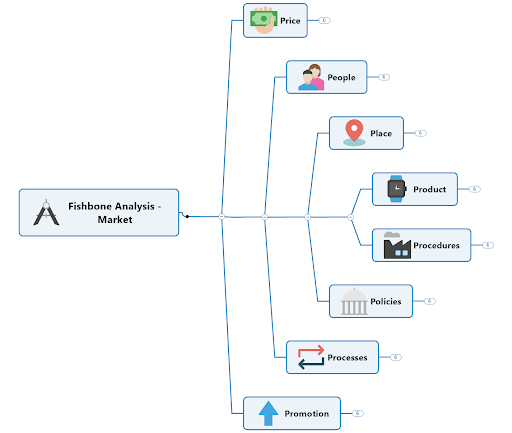
 Marketing or product marketing: Explore the potential causes that might be hindering your product’s success in the marketplace by exploring all the areas that influence the adoption of your products.
 How to create a fishbone diagram in MindManager in 5 steps
Fishbone diagrams are quick to make in MindManager and the examples above are included as templates to make it even easier.
MindManager’s ease of capturing ideas during brainstorming makes it the ideal tool to capture and organize potential causes. The visual format allows you to see all the causes simultaneously, draw relationships between causes, and identify if the root cause is found multiple times within the diagram.
Here’s how to create a fishbone diagram:
- In MindManager, go to the File menu, select New and then click into the Problem-Solving folder. There you’ll find three templates for Fishbones, the manufacturing, service, and product analyses. Select a template.
- Enter the issue in the central topic.
- Next, either brainstorm potential causes and add them as floating topics initially and categorize them after the brainstorming session. Or, use each category as a guide for a mini-brainstorm session and enter the potential causes directly in the appropriate branch.
- Add more details to your causes as new subtopics or notes with the cause itself.
- Once all the potential causes have been identified, you can take the diagram a step further and rank each cause. One way to do this would be to use the Priority marker to rank the cause between 1 and 9. You can later filter the diagram and view specific priorities and hide the less important ones that will distract the focus of the team.
Key MindManager features for fishbone diagrams
There is no one single ‘right’ way to create, categorize, or rank items within a fishbone diagram.
With that said, here’s a list of ways to apply some of MindManager’s features to transform an ordinary diagram into a powerful application to visualize and empower your work.
- Use color (fonts, topic fill color) to categorize different causes.
- Change the font characteristics to emphasize different causes (e.g. bold, larger fonts, different font types, etc.).
- Use topic images to add greater context and enhance the visualizations.
- Write topic notes for more in-depth details related to each cause.
- Apply icons and tags to categorize causes.
- Hyperlink or add attachments to provide more details.
- Draw relationship lines between different connected causes throughout the diagram.
- Assign resources to any causes that you have identified. This may clarify who is responsible or accountable for that cause.
- Collapse branches for a quick overview or drill down into all the details.
- View the diagram through multiple lenses. For instance, you are not confined to the layout of the Fishbone diagram. Switch views to see the diagram as an outline, or dive in the Schedule, Icon or Tag views to see your content in groupings based on your assigned categories or due dates.
- Filter content to either show or hide topics that you have annotated with tags or icon markers. For instance, filter on all the top priority potential causes that need additional investigation.
- Share your diagram by either publishing it onto the web (and sharing a link) where anyone can open and view the Fishbone diagram interactively in their browser or export the diagram into a variety of different formats (e.g. Microsoft Word, HTML5, Microsoft Project, etc.).
Download MindManager today to get started on your fishbone diagram!

