Everyone loves a good story; from Aesop’s famous fables to hearing a friend recount their weekend, the art of storytelling appeals to everyone.
Storytelling today is now more important than ever before. We live in a world where access to information is quick, cheap and unlimited. With this deluge of information we now face the problem of expressing it all in a way that is understandable, entertaining, and insightful.
What is Visual Storytelling?
Visual storytelling is having the ability to express complex data easily, while at the same time, having it evoke an emotion. Information visualization is the key to achieve this. We’ve tried to tackle this issue in a previous post When is a Picture Worth 2,403 Pages. The point remains that if you are successful at information visualization then your images will be able to easily express complex data while being entertaining and instilling an emotion associated with it. This should not come as a surprise though, as our brains are wired for the visual over text – To learn more about this see our post How our brains are wired to memorize pictures. But enough talk, below I’ve supplied some visuals to really drive home what it is I am talking about here.
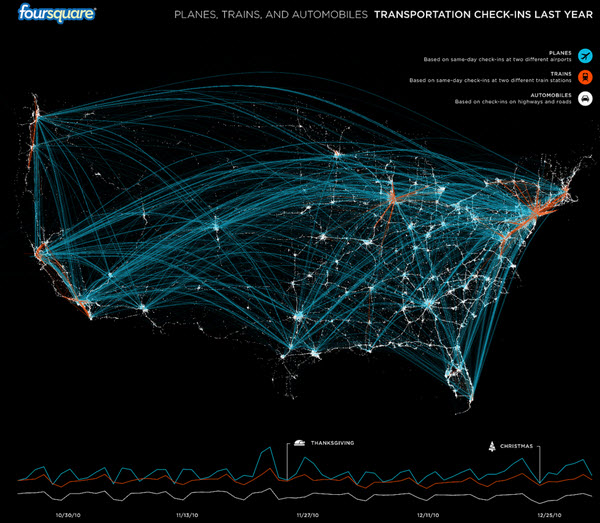
This image is of foursquare check-ins over the last year. As you can see it really drive home that sense of freedom that is embedded in American culture. Additionally, this image really helps push the argument for a transcontinental high speed rail line in the USA.
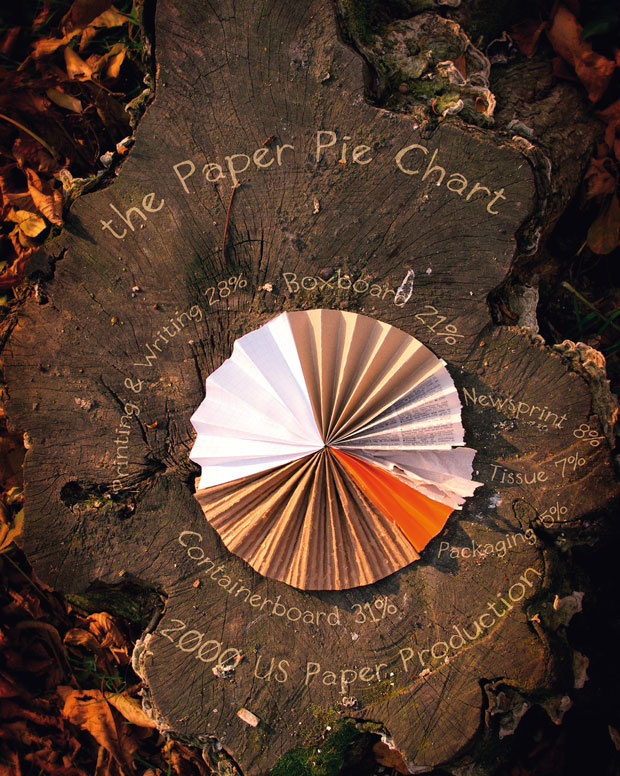
This pie chart is constructed of varying types of paper (cardboard, tissue, newsprint) all to help express the breakdown of paper production in the USA.
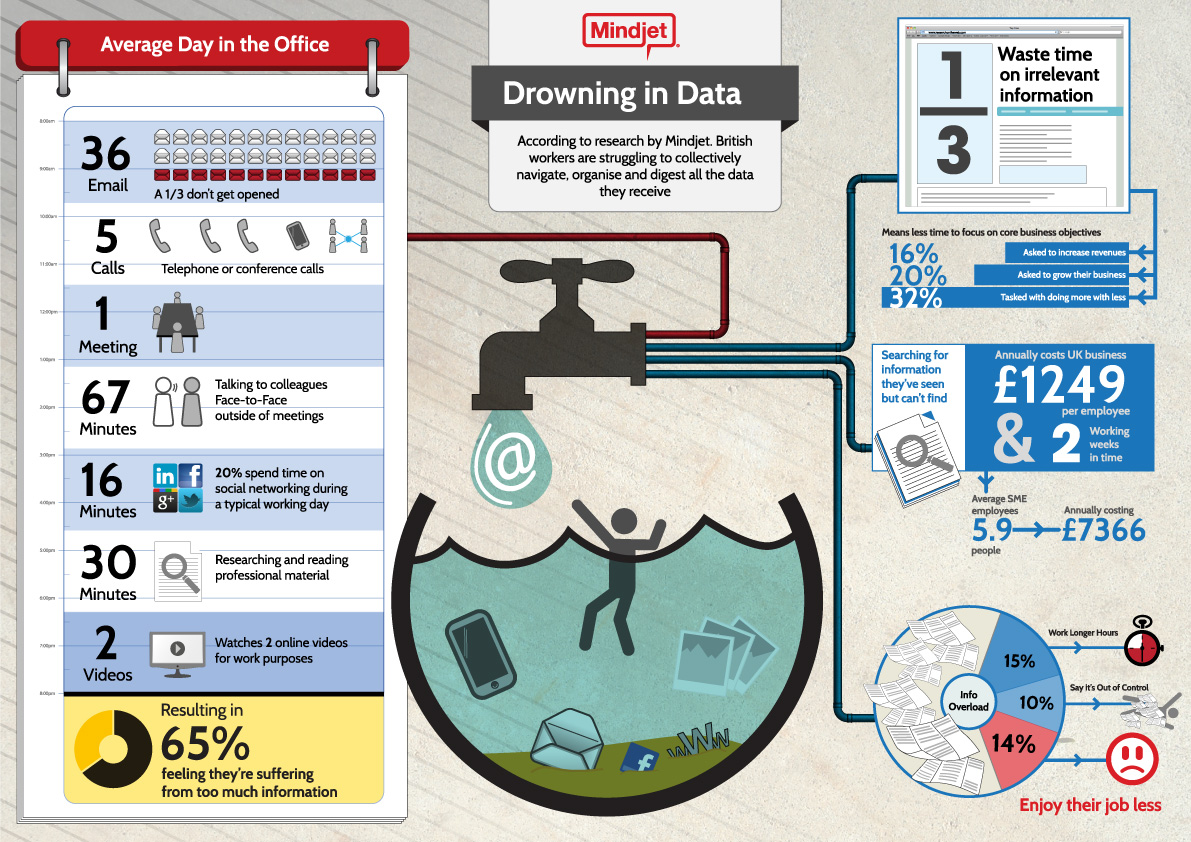
Our very own Mindjet Infographic does a great job walking people through the reasons why workers are suffering from information overload and its consequences.
Regardless of what format your images are in, having strong evocative images expressing data is an increasingly important skill in this age of Information Overload.
Your Turn
Do you have any examples of cool visuals that tell a story?


