Knowledge management (KM) is the practice of capturing, curating, organizing, and sharing information and resources within an organization. It involves utilizing different techniques and technologies to ensure that data is properly stored and easily accessible at any point. Moreover, it enables the fast collection, creation, storage, and sharing of information to achieve different business goals.
For KM to be successful, certain tools are often used to streamline the capture of information. For example, knowledge management diagrams are often utilized to improve KM within an organization. They are well-organized representations of data that enhance brainstorming, collaboration, and decision-making on an individual or group basis.
MindManagerⓇ is a visualization software that offers users various mind mapping templates that can be used as knowledge management diagrams. With MindManager, shared information and valuable knowledge are placed in new contexts in easy-to-understand ways so that information is always up to date and available centrally at any moment.
Some of the most used knowledge management diagrams include:
Organizational charts (org chart)
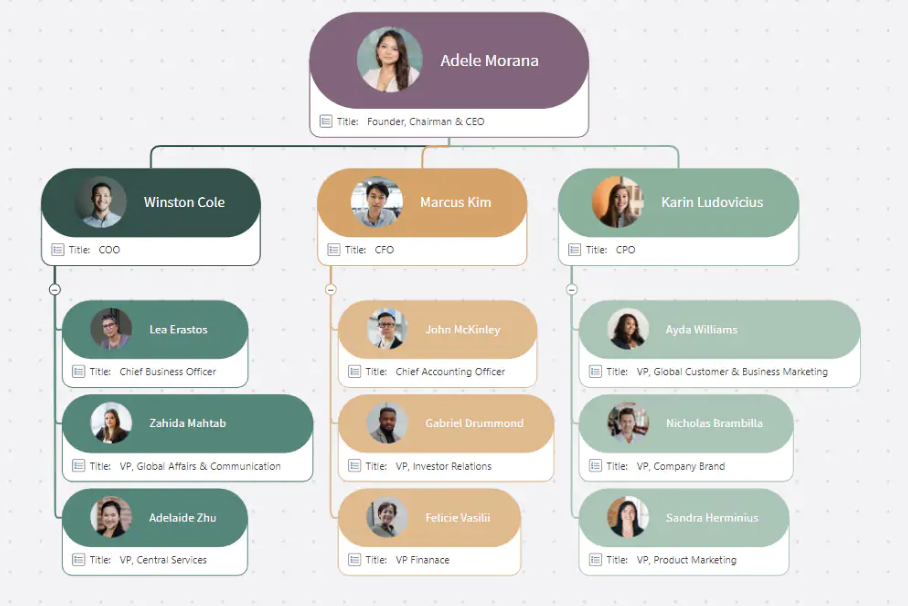
An organizational chart (org chart) is a visual representation that displays how an organization’s tasks are distributed by outlining tasks, responsibilities, needs, and hierarchy. Some organizational charts include job details, assigning authority, and chain of command. Organizational charts are often used in businesses, government agencies, universities, and other organizations to represent these changing structures visually.
An organizational chart works as a knowledge management diagram by organizing detailed information about the structure of a company and related information, such as roles and job responsibilities. An org chart is beneficial for short-term project management and long-term strategic planning, as well as various other HR-related tasks like employee on-boarding and off-boarding. Additionally, it provides transparency between departments, fostering better communication and collaboration across teams.
Flowcharts
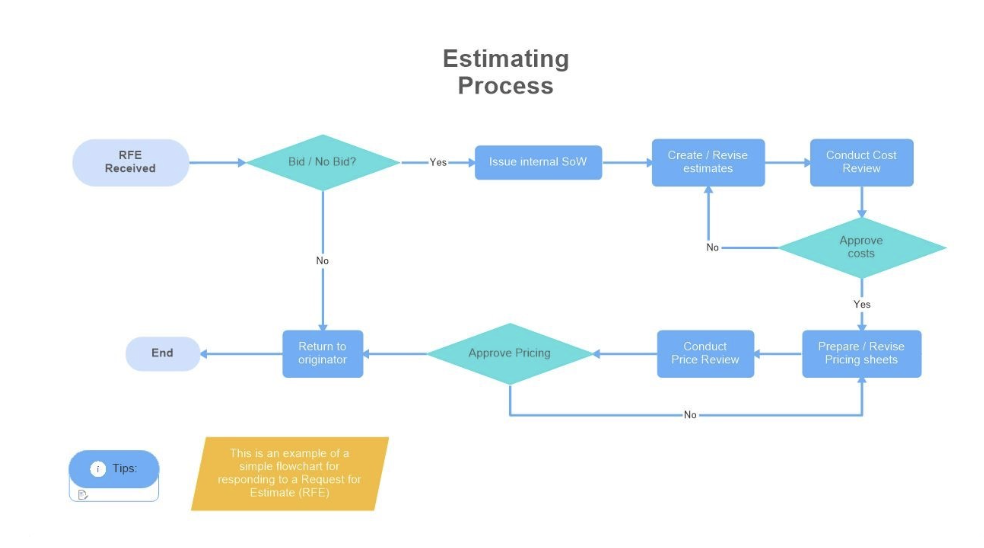
A flowchart is a visual representation of a process, task, or workflow that helps with knowledge management. It provides a step-by-step map for the reader to understand an end-to-end business process or task by using symbols and arrows to connect each step of the process.
Flowcharts can be simple or complex. For example, a simple flowchart may only have a few steps and just one main path without any decisions to be made. On the other hand, complex flowcharts can have many steps, multiple diverging paths and decisions to be made, and several different endpoints.
Flowcharts can help knowledge developed within an organization become systematized and shareable among teams and departments. This type of knowledge management diagram enables organizations to get up to speed on new processes or procedures quickly. They are also helpful in documenting company protocols and best practices so that everyone follows a consistent methodology.
Spider maps and mind maps

A spider map, or mind map, is a type of knowledge management diagram that looks like a spider web. Here, your main idea or focus question goes in the center of the map, and other topics branch out radially.
Mind maps or spider maps work best when exploring various facets of one central concept. Some uses for spider maps include studying a topic with many different sub-topics or brainstorming around a central business concept.
These types of maps serve as a starting point for organizing large amounts of data, allowing users to quickly identify the most critical topics based on the size and position of the nodes in the map. In addition, by making it easy to visualize complex data sets, spider maps or mind maps help you to spot patterns that could indicate overlooked opportunities or connections between different topics. This can aid in decision-making, strategy development, and overall knowledge management.
Concept maps
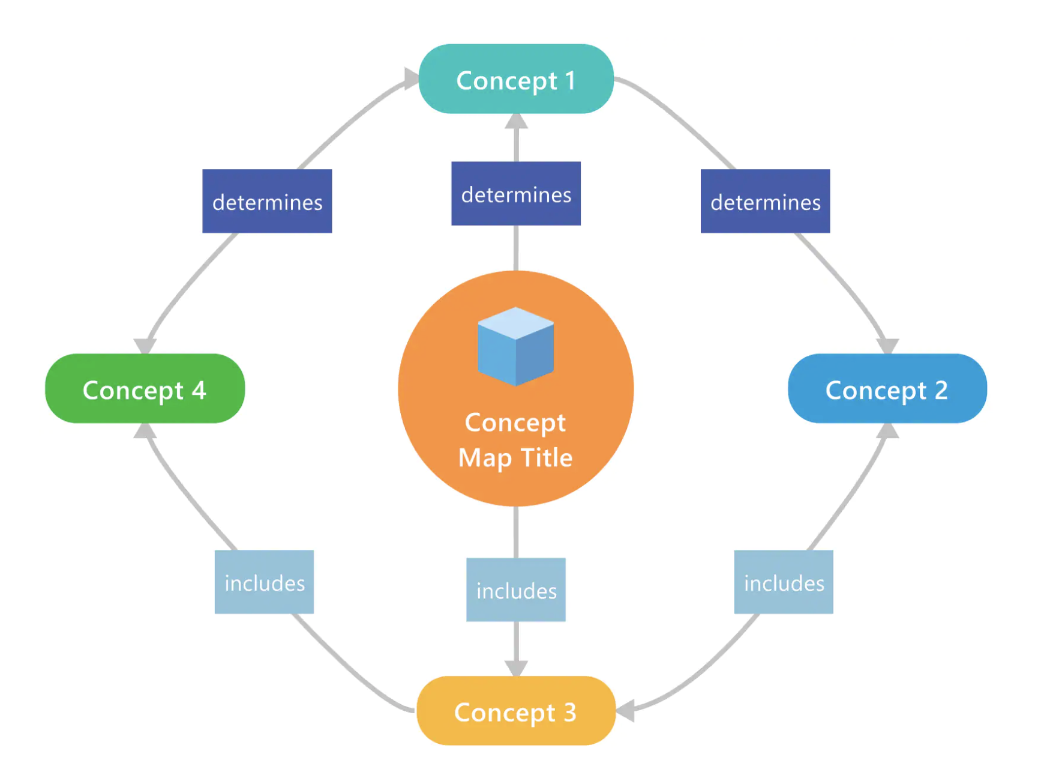
A concept map is a way to visually display the relationships between different concepts, ideas, and pieces of information. Concept maps are hierarchical, with one main idea or focus question and several sub-topics, key concepts, and related ideas.
Although they look similar, concept maps are not the same as mind maps. Concept maps are generally more robust visualizations, with additional context and connections between ideas.
The categories created in the concept map help knowledge managers keep track of their data more easily. In addition, concept maps help you make connections between different parts of the information you have stored. They can also be used to create visual relationships between topics, which makes it easier for users to understand and navigate complicated ideas quickly.
Swim lane diagrams
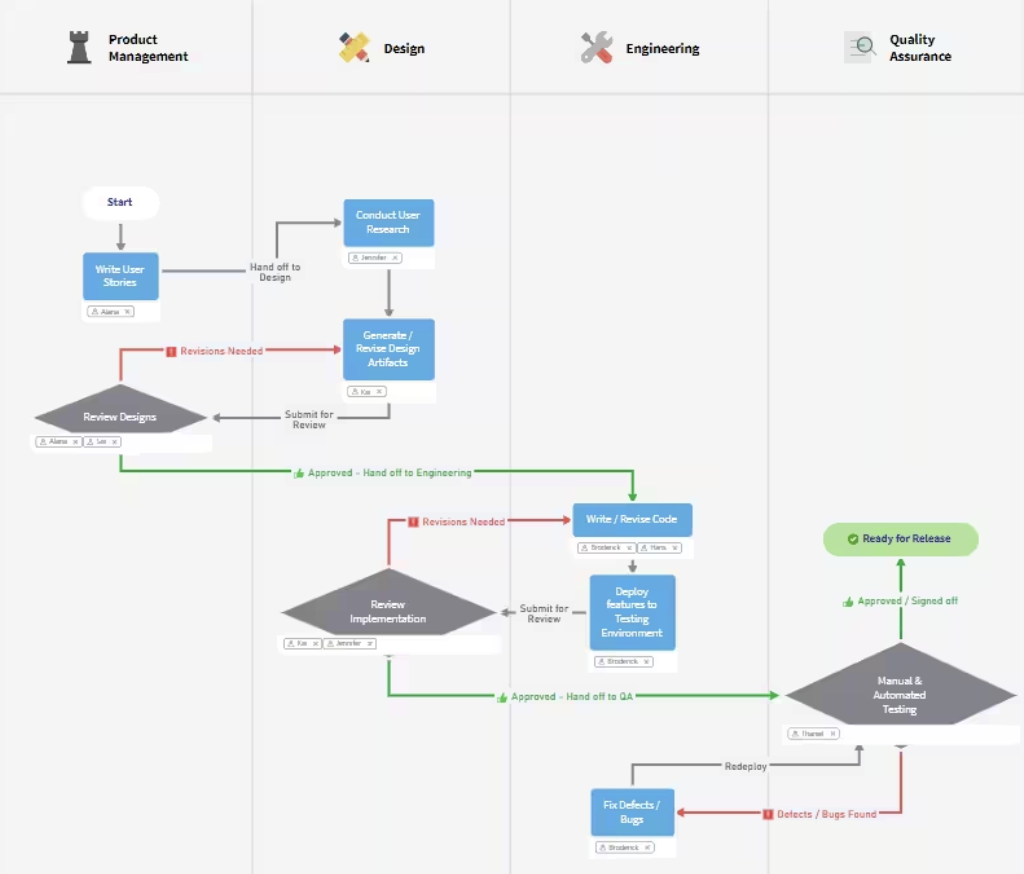
Swim lane diagrams are flowcharts that show a process from start to finish. These diagrams also show who is responsible for each step in the process. Much like a swimming pool with established lanes for each swimmer, a swim lane diagram has horizontal or vertical lanes belonging to each person involved in the process.
A swim lane diagram helps with knowledge management by giving organizations a visual representation of their processes, workflows, and data. It can break down complex tasks into smaller components, enabling organizations to see how each part fits into the larger picture.
Swim lane diagrams also provide visibility into the various stakeholders involved in a process and their roles and responsibilities, which can be critical for successful knowledge management.
Using MindManager for knowledge management
MindManager® can help visualize your thoughts and ideas, making it easier to organize them. It also helps you create new connections between ideas to help you understand the relationship between them and create new ideas. That makes it easier to communicate your ideas to others and subsequently, capture and transfer knowledge.
Check out our free trial to see how you can use knowledge management diagrams at your organization.
Furthermore, if you’d like to know more about knowledge management and how it can boost productivity and increase positive outcomes at your organization, listen to our free webinar or access our e-book!

