By: Emily Finlay
You can communicate almost any concept better in visuals than in words. When your company is trying to understand how to best improve and grow, business process diagramming is an excellent tool. These visuals help you see your operations from start to finish. You can find areas that need work and new opportunities to expand.
If you want to use a business diagram, you first need a tool that will help you create it. In our previous article about these charts, we introduced you to the best options for outlining business processes. These visuals include:
- Flowcharts
- Mind maps
- Organization charts
- Process infographics
- Swimlane diagrams
- Workflow diagrams
These graphics can be used in a variety of ways and for various purposes. As you determine the right option for your needs, you can use this guide to find the best business diagram templates and tools to use to create your visuals.
Why should I create a business process diagram template?
Diagramming business processes is a revolutionary asset to your improvement efforts, but they do take some time and work to create. You can save time for future analyses by creating or finding templates that you can use for different areas of your operations. With the tips in this article, you will be well equipped to optimize your business and its processes on a regular basis.
Best business diagrams tools and templates
No matter the reason you make it, it’s important to use a tool that allows you to design a diagram that captures the flow of your processes. To keep things simple, we’ve organized the tools and templates in this article under the types of diagrams you can use to map processes. These best options will help you understand and communicate how your business flows so you can achieve the best results.
Here are six must-use business diagram tools and templates for any organization.
1. Flowcharts
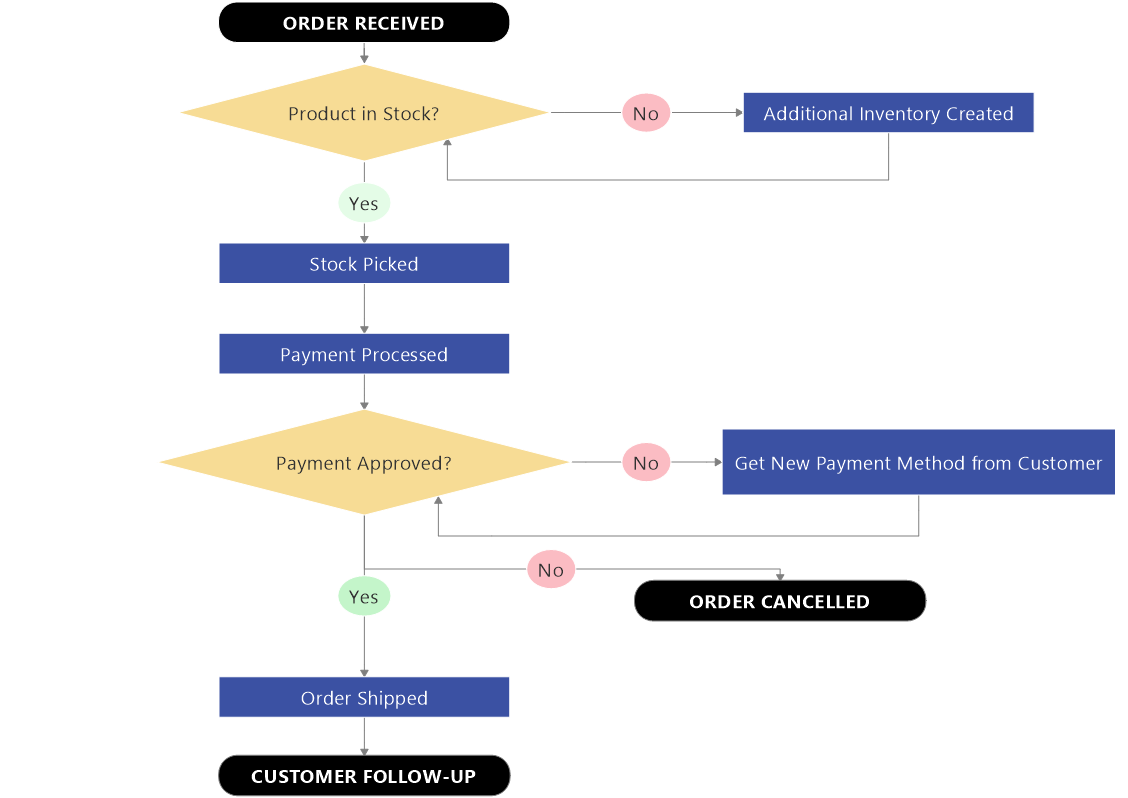
Flowcharts are the most popular option for business diagrams. These visuals use shapes and arrows to demonstrate how your operations move from one stage to the next. Along with showing how your processes work, they can also highlight steps or areas that disrupt this flow. Most importantly, flowcharts can be used to outline complicated processes with multiple steps, giving you more flexibility with your diagramming.
Business diagram tools for flowcharts
- Microsoft Office Suite – Believe it or not, you can create flowcharts in Word, Excel, and PowerPoint. Microsoft even offers tutorials to help you develop your charts.
- Google Workspace – Like the Microsoft Office Suite, Google allows you to develop flowcharts in several of their tools, including Docs, Slides, and Sheets. You can also use Google Drawings to make your charts before pasting them into other documents.
- MindManager – Flowcharts are one of the many diagrams that MindManager was designed to make. You can find step-by-step instructions, plus numerous templates to help you get started.
Business diagram examples: Flowcharts
What should your flowchart look like? Here’s an example of a simply process flowchart created using MindManager.
2. Mind maps
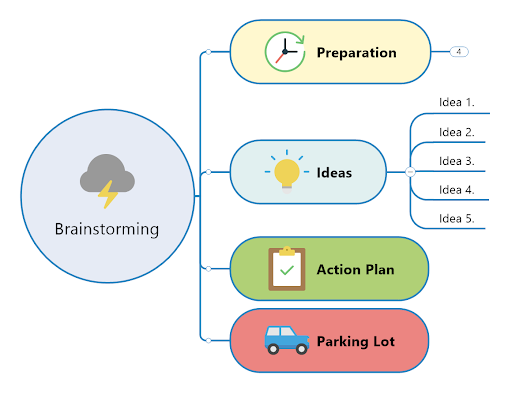
Mind maps help you organize your thoughts around a specific topic, such as a product or procedure. You place this central idea, typically within a large shape, at the center of your diagram. Using arrows or lines, you can then surround it with different thoughts or ideas about this topic. Along with visualizing specific processes, these tools can help you organize your brainstorming ideas about the topic.
Business diagram tools for mind maps
- Business tool suites – Both Google Workspace (Docs, Slides, and Sheets) and Microsoft Office Suite (Word, Excel, and PowerPoint) offer tools to create mind maps. Some tools are easier to use for these charts than others, but all have the capabilities.
- Note-taking tools – Microsoft’s OneNote has a mind-mapping tool built into the app. You can use this tool to color code and build your chart right in OneNote.
- MindManager – Designed for professional use, MindManager’s mind maps are ideal for presentations and brainstorming sessions. Clean and easy to use, our tool also comes with templates that you can customize for your own needs.
Business diagram examples: Mind maps
There are numerous ways to mind map your business processes. You can use these examples to find the best design to use for your business.
3. Organization charts
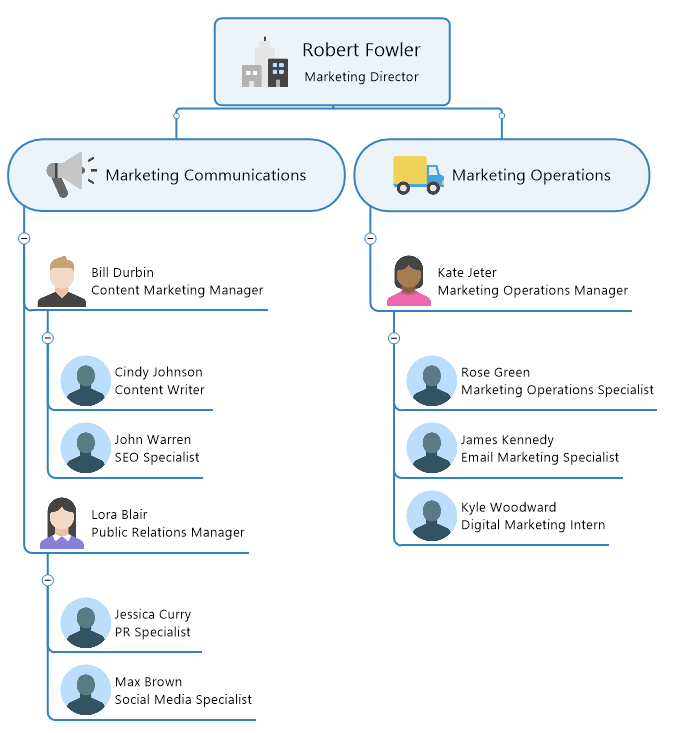
Though it isn’t the most popular business diagram, an organization chart simplifies the hierarchy within your organization and employees. Working down from your boss or team leader, you can show who reports to whom and what each person is responsible for.
Business diagram tools for organization charts
- Whiteboards and poster board – Since these charts keep every day moving smoothly, it’s helpful to keep them available and visible to everyone on your team. You can draw them on a whiteboard or hang a poster board somewhere in the office to improve efficiency.
- Microsoft Office Suite – Both Office and PowerPoint have a “hierarchy group” option within their SmartArt design tools. You can also use Visio to create organization charts that you can then add to Excel.
- MindManager – Organization charts can improve interdepartmental communication, as well as assist in on-boarding. For more complex charts like these, MindManager’s range of templates and easy customization options make it the best option for your organizational diagrams.
Business diagram examples: Organization charts
The purpose of your chart will determine the direction you take your diagram. MindManager offers several templates for organization charts to make your work easier. Here’s an example of one.
4. Process infographics
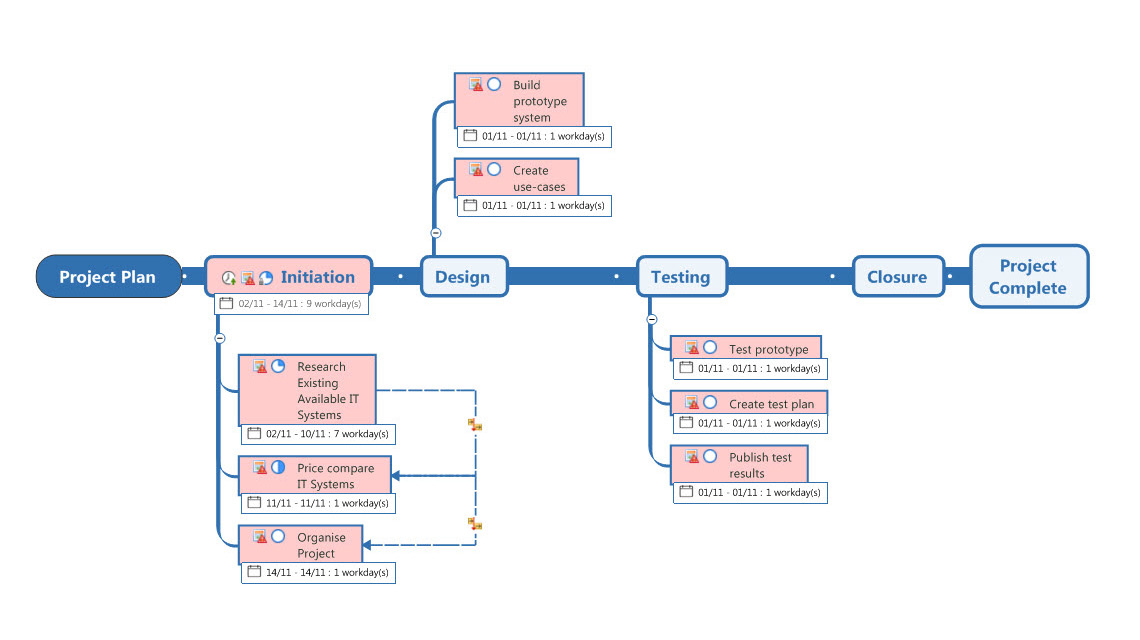
Sometimes, visuals alone aren’t enough to communicate your processes. If you need a diagram with a lot of text, process infographics may be the best choice. Though they look similar to flowcharts, these visualizations use both text and graphics to represent your various procedures.
Business diagram tools for process infographics
- Canva – This design tool includes templates to help you create visually appealing infographics with different options for text. Canva enables those comfortable with graphic design to create beautiful work, but it can be difficult to use if you need to make significant changes to expand or adjust the templates.
- Hubspot – This marketing platform offers several templates that you can import into business tools, such as PowerPoint, and customize. Like Canva, these templates may be limiting and hard to adjust to your needs.
- MindManager – MindManager templates make business process mapping easy. You can show the flow of your process, including text to expand on each step. You can also tag your teammates directly in the graphic to keep everyone on the same page.
Business diagram examples: Process infographics
Your process infographic can be as detailed or simple as you want. Get inspiration from the samples included below.
5. Swimlane diagrams
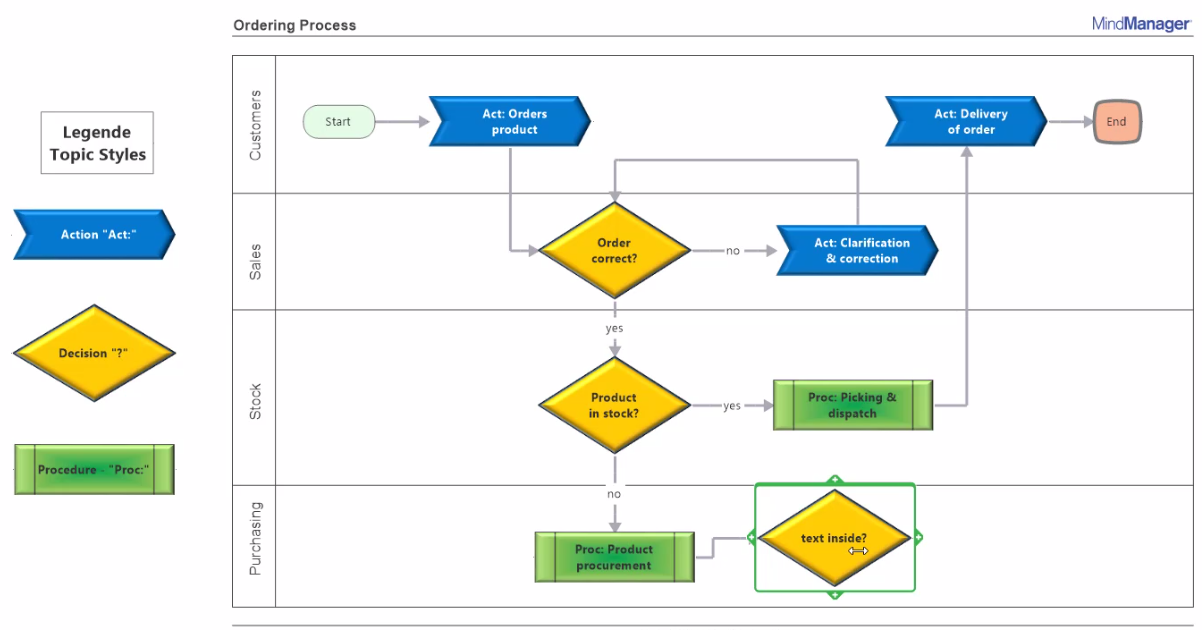
Swimlane diagrams are used to highlight the parts of a business process that involve different team members or departments. These flowcharts are set onto a grid that resembles a swimming pool, with horizontal or vertical rows similar to swimlanes. You can use different colors for each row, clearly showing who is responsible for which parts of the process.
Business diagram tools for swimlane diagrams
- Google Workplace – Using a combination of shapes, lines, text labels, and the table function, you can design your swimlane diagram in Docs, Sheets, and Slides. If you want more design control, you can also use Google Drawings to make more complex diagrams.
- Microsoft Office Suite – Similarly, you can use Word, PowerPoint, and Excel for your swimlane diagrams. You may also be able to find templates for these tools.
- MindManager – Use templates designed specifically for a variety of diagramming needs. You can adjust your chart’s size without being restricted to a document’s dimensions. You can also tag participants directly for a more effective use.
Business diagram examples: Swimlane diagrams
Quickly design the graphic that best represents your processes with a chart like this one:
6. Workflow diagrams
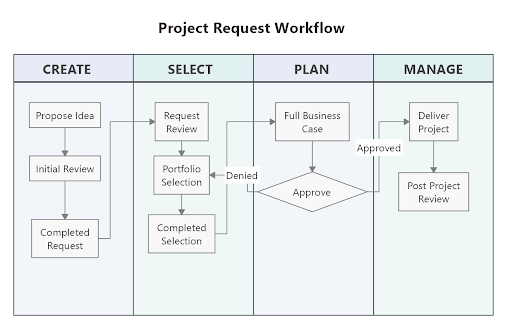
Workflow diagrams are key to understanding the work involved with a specific task or a process used by a single person. Like a flowchart, these graphics use shapes and arrows to represent each step. You can use them to get a big-picture view of the process and find ways to improve it.
Business diagram tools for workflow diagrams
- Microsoft Office Suite – Since workflow diagrams are very similar to flowcharts, you can use PowerPoint, Word, and Excel, as well as the available flowchart templates, to create your chart.
- Google Workplace – Likewise, Google Sheets, Slides, and Docs can also be used to design your workflow charts. Because both sets of office tools aren’t purposed for graphics like this, however, you may struggle to create complex workflow charts in both.
- MindManager – MindManager is built to create diagrams, so its simple interface and powerful tools empower a variety of workflow illustrations.
Business diagram examples: Workflow charts
Not sure where to start with your workflow outline? Use the example below or one of our templates to develop a diagram that fully represents your processes.
