By: Emily Finlay
People are visual creatures. Understanding operational processes or applying data to decisions becomes easier when you can see a simplified form of the information you’re working with. This is especially true of business process diagramming.
These data visualizations break your operations into smaller, more easily understood pieces of information. You can then use these charts and graphs to explore the strengths and weaknesses of your processes. You can also work more effectively with your team to find solutions when everyone is on the same page.
But which business diagram should you use for the best results?
In this guide, we will introduce you to the types of business diagrams, how you can use them, and the benefits they offer.
What are business diagrams?
Business diagrams represent your business processes in a visual way. Also called business process mapping, these tools show the steps involved in your procedures. Used for anything from production processes to employee onboarding, business diagrams clearly map out everything involved in your operations.
Because each industry and company has its own way of doing things, there are many options for creating a business diagram. In the next section, we’ll go through each of the visuals you can use to map your processes.
Types of business model diagrams
Flowcharts
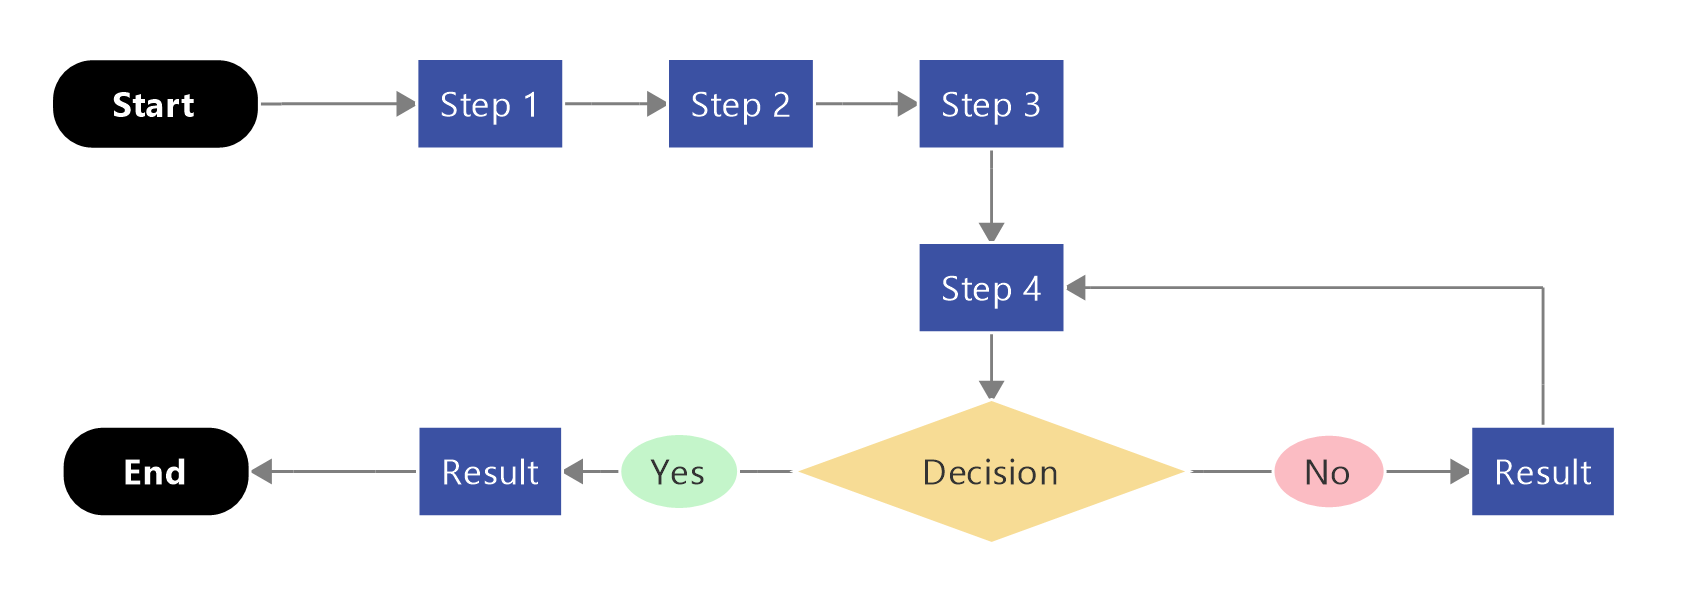
Flowcharts are used to visualize processes or systems. These diagrams use a variety of shapes, such as ovals, rectangles, and diamonds, to depict various steps or pieces of these processes. By using arrows to show how each stage flows into the next one, you can better understand and analyze the sequence of your systems.
Mind maps
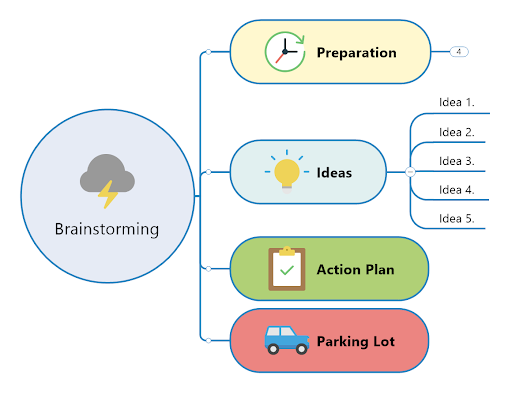
Mind maps help you organize data around a central idea. If you wanted to map your quality assurance process, for example, you could use a mind map to outline the different actions you take to ensure quality throughout the production process.
Building a mind map starts with a large shape in the center to represent the main topic. You can then use lines or arrows to move users to the steps or ideas that are included in this central idea. You can also add additional levels or images and text to further explain these steps.
Organization charts
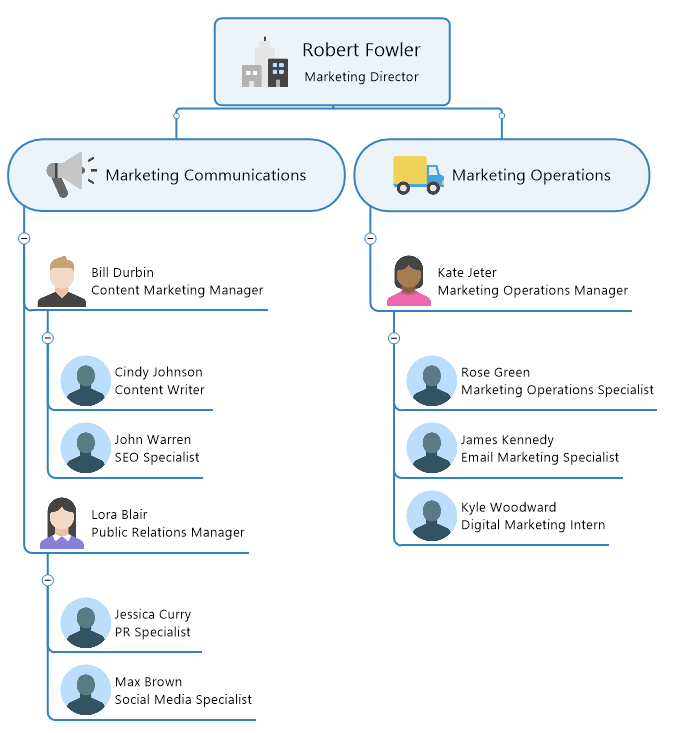
Organization charts display the structure of your organization or team. A large box at the top shows the leader, either the boss or team manager. Lines then lead down into boxes that show the next level of leadership, repeating until the organization is fully mapped out. These diagrams help viewers understand the structure of the staff. They can also be used to illustrate your chain of command and decision-making hierarchy.
Process maps
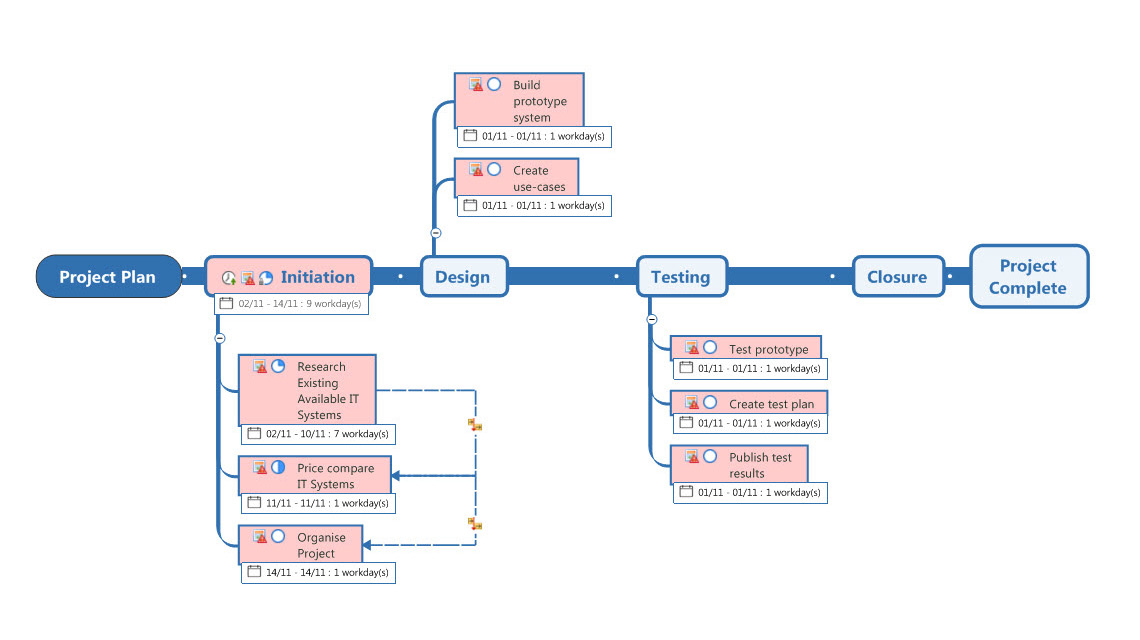
For diagrams that need large amounts of text, a process map is a great choice. These graphics use a combination of text and visuals to guide readers through a process. If you wanted to diagram a customer’s journey through your company, you could use an infographic with a flowchart design. Including blocks of text to explain each stage and guide the user along offers more information than a standard flowchart, also relying on visuals to make the concepts clear.
Swimlane diagrams
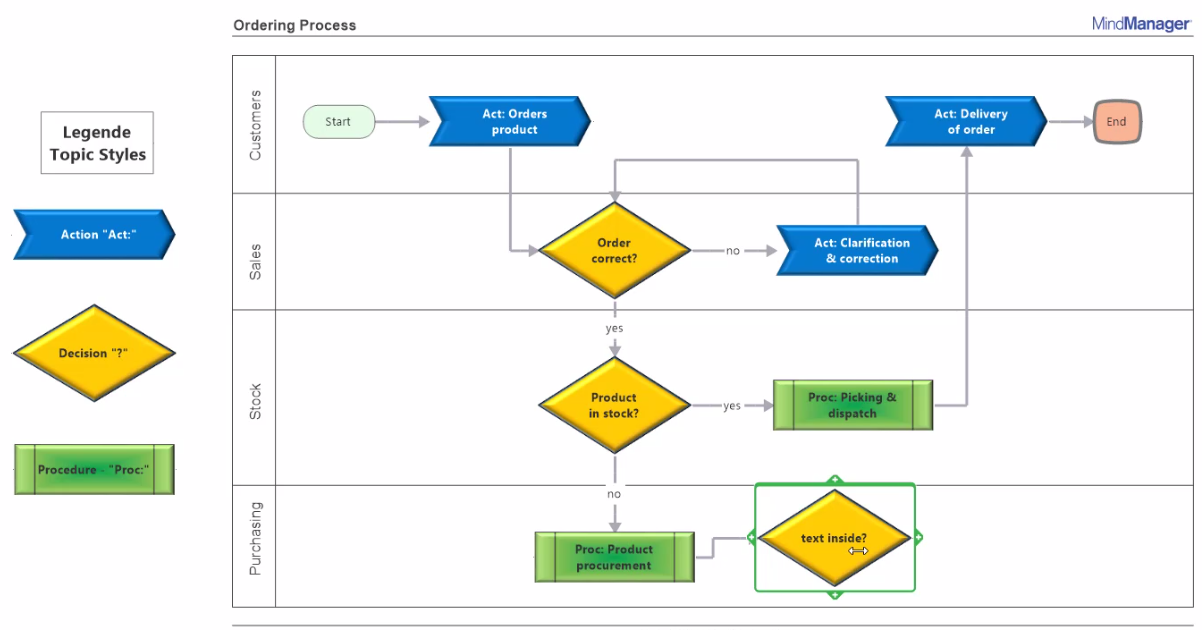
When processes cross multiple departments, swimlane diagrams clearly display these processes for easier understanding. Placed within horizontal or vertical rows (each representing the different departments), shapes and arrows outline the stages involved in your procedures. Swimlane diagrams show how your processes move through each area and what steps are the responsibility of each department. These charts can improve both communication and collaboration.
Workflow diagrams
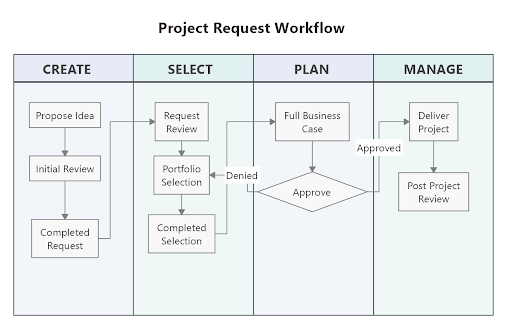
Workflow diagrams are similar to flowcharts, but they focus exclusively on a specific task or process used by one person. Using a variety of shapes and arrows, you can use this graphic to outline the steps involved. Workflow diagrams are a great way to show new hires how to perform tasks. They can also be used to find weaknesses within your processes.
How can I use business diagramming?
Business diagrams are designed to help you and your team improve and understand your processes. Though you may think your procedures are optimized and efficient, these visuals uncover areas that may need improvement. They also give you the insights you need to realign your processes with your main goals.
Outlining your procedures equips your team to be more efficient and effective in everything they do. Rather than keeping the status quo, you can find ways to save on costs and time as you optimize every process.
Business process flow diagram use case examples
There are many situations where business diagrams are valuable assets. In this section, we’ll walk you through some of the ways you can use data visualization to grow your business and exceed customer expectations.
Internal audits
There are many reasons to conduct an audit within your business. Perhaps you received a complaint about your product or want to assess your compliance with industry regulations. No matter the reason, diagramming your processes should be the first step.
When you lay out the steps involved, you can clearly see areas that may be slowing production or affecting quality. You can also use your diagram to make sure employees are following the proper procedures. Armed with your guide, you won’t miss any issues that might exist.
Onboarding new employees
Offering a diagram that outlines the steps needed for a task to your new employees empowers their work and saves your time. You won’t need to walk them through your process or direct them to the appropriate collaborators. Instead, they can quickly understand and adjust to the work involved.
Preparing for a launch
Whether you’re launching a new product or opening a new location, your business process flow diagram will keep everything moving smoothly. Your team will be prepared in advance and ready to handle their responsibilities. If something goes wrong, you can use your chart to find the best way forward. You can focus on wowing your customers, confident in the plan you’re following.
The benefits of using a business analysis diagram
When a business uses a process diagram, they can access their data in a new way. From meetings to improving sales, there are endless ways to benefit from these visuals. To help you understand how business diagramming can support your business, discover the benefits it offers below.
1. Improve communication
Unclear communication processes are one of the easiest ways to create chaos within a team and organization. If your employees don’t know who to go to, none of your projects will run smoothly. Instead, multiple people will receive the same information and it may never get to the people who need it most.
Outlining your processes shows how you expect employees to communicate data. You won’t run the risk of missing out on key information and your team can move forward more quickly. It also solidifies your procedures for future projects. Your team can do more in less time when they work together more effectively.
2. Optimize processes
Analyzing your processes on a regular basis keeps your team working better as time passes. When you first create the procedure, diagramming helps you find the best ways to get things done. As time goes on, you can use your diagrams to identify new ways to improve.
This also strengthens your responses to changes. No matter the shift, you can identify the ideal pivots to make to maintain and grow your business.
3. Maintain consistency
People like patterns. Laying out the steps to your procedures creates a reliable rhythm and routine to the work you do. Like a well-run machine, you can establish processes that encourage productivity. Consistency also ensures that your team can deliver the same level of quality with everything they do. Everyone will know exactly what is expected of them and what they need to do to succeed, keeping your results dependable and exceptional.
4. Stay compliant
When companies violate regulations, it’s often due to deviations from policy that aren’t caught by management. A business process diagram minimizes this risk by clearly showing what each task requires to stay in compliance. Even when new staff joins your team, you can ensure that they follow your exact steps to keep your business operating within regulations.
5. Beat the competition
A business that runs well internally will also perform better in its industry. You won’t be losing money to inefficiencies, giving you more resources to expand. Uniting your team through excellent communication strategies and clear roles will empower them to perform at their best. Your business will operate as it’s designed to from top to bottom, allowing you to offer industry-best results to your customers.
Most importantly, improvement will be baked into every area of your business processes. Your organization will always focus on doing better and doing more, helping your customers succeed at the same time. As you continually work to make your processes that much better, you will show the market that you are the best choice available.

