As the product lead for Mindjet for Windows and a huge enthusiast myself, I use Mindjet to organize my work and personal life, capture and organize feature requests, and plan and implement product releases. I love engaging with our community to learn how you’re using our software, but also to better understand your needs.
I’m excited to share some of the new and improved capabilities of our Mindjet MindManager 14 for Windows release. With the introduction of formulas, we’re amplifying the power of mapping!
More Than the Big Picture
For everyone familiar with our mapping software, you realize how powerful it is to organize your ideas and other “qualitative” information. Our most common uses of Mindjet maps are to brainstorm new ideas, formulate strategies, develop and manage detailed project plans, draft books and presentations, or create a dashboard that organizes and links to all the elements in your life.
We’ve been great at providing the ‘big picture’ and letting you drill down into all the details.
For MindManager 14, we’ve added an entirely new capability that lets you capture and analyze “quantitative” information. In our last release, we introduced a feature called the AutoCalc, which allowed you to create very basic roll-up summaries of numeric data. The basic calculations let you find the sum, average, minimum, maximum or count within a branch. This whet our customers’ collective appetite, and we soon started receiving many requests to further advance this capability.
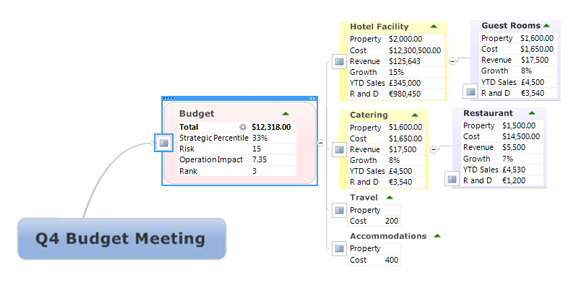
The updated Formulas feature in MindManager 14 for Windows introduces a new way to plan using both qualitative and quantitative information. Your formulas can drive the development of detailed visual budgets, sales plans, balanced scorecards, risks assessments and much more. I love this because it helps you understand the health of a project or business at a glance, and then provides more details so you can better understand the root causes and drivers behind any problem or opportunity.
You may be thinking: wait a minute; I already have Excel for number crunching. Why is this so great?
Excel is an amazing tool to calculate and analyze data. Excel, however, does a poor job at presenting qualitative information. And it isn’t that easy to quickly manipulate all the formula inputs to assess different scenarios.
Mindjet provides the best of both worlds. We created something that we hope you feel is more powerful than either Excel or mapping alone. Often, we need to work with more than just ideas, and decisions aren’t just about the numbers either. You need the both the context and the numeric data to make your most informed and best decisions.
Let me explain a bit how the magic works.
The Nuts and Bolts
With Mindjet’s new Formulas function, you’ll be able to calculate the value of a property by evaluating an expression that uses either a range of topic properties, specific properties that you select, or both.
For example, I could add a formula to calculate the sum of the Costs for a branch:
[Branch Costs] = SUM(Descendants[Costs])
Or, the sum for the whole map:
[Map Costs] = SUM(MapTopics[Costs])
Or, for just a couple of topics:
[Total Costs] =Topic [Product Cost] * Topic[Inventory]
And, as the example above implies, you can add mathematical expressions too. Use parenthesis, exponents, multiplication, division, addition and subtraction. The formulas are easy to create once you get the hang of the syntax (which is explained in our help documentation).
We’ve provided some helpful buttons in the formula editor to help you build your formulas. The Topic Ranges create a dynamic experience that allows you to drag and drop content or apply filters without having to adjust your formula. Applying filters will update calculations for theTopic Range. For instance, you can update calculations to only compute your Priority 1 topics. Or, apply a filter to only show the incomplete items.
We didn’t stop with just Formulas. We’ve added conditional formatting with the new SmartFill feature. You can turn your maps into interactive dashboards that highlight changes like when your plan is over-budget (RED) or getting close to being over-budget (YELLOW). For a video walkthrough of these exciting new features, check out Better Budgeting and Forecasting with MindManager 14.
I’d love to hear how you’ll use Formulas and the conditional formatting in your maps. Our team is already hard at work making additional enhancements as we continuously look to improve your experience. Leave a comment below or connect with me with your ideas on Twitter, LinkedIn, Facebook.