Albert Einstein once said, “If I can’t picture it, I can’t understand it.”
Sometimes, words or text alone aren’t enough to capture what we see in our minds. That’s why visual thinking tools rely predominantly on images to help us explore, explain, and comprehend new ideas and information.
Visual thinking can be explained as a sketch in a notebook or as full-featured as an interactive project planning mind map. But from workplace spaces dedicated to wall-drawing and collaboration, to the virtual whiteboards built into video platforms like Zoom, visual thinking tools are essential communication aids.
In this guide, we’ll explore some visual thinking tools you can use to support everything from idea creation to workflow management.
How to use tools for visual thinking
If you’re unclear on how to use visual thinking tools, consider this: Whether you’re part of a team or client meeting at work or you’re brainstorming ways to raise funds for your local charity, there will always be times when it’s just easier to explain an idea visually than it is to try and spell it out verbally.
No matter how you make use of them, visual thinking tools facilitate discussion, understanding, and learning by helping us:
- Express complicated ideas and clarify vague concepts.
- Make connections and draw useful conclusions from various types of information.
- Manipulate and play with designs, scenarios and outcomes in a low-risk, cost-effective way.
While rigid, linear tools tend to leave our best thinking on the table, visual thinking tools benefit everyone sitting around it: the thinkers trying to get ideas out of their heads, and the doers trying to understand a concept or problem.
Top six visual thinking tools, and how to use them
There’s no shortage of tools you can use to promote visual thinking and communicate better. Below, we dive into a few visual thinking tools we feel are especially helpful for encouraging shared understanding and for extending that understanding into organized ideas and action.
1. Virtual or physical whiteboards
Whiteboards aren’t new, but they’re still a great way to get your message across quickly and visually, especially in meetings. Some digital whiteboards even offer unlimited space and a range of graphics and icons to help you draw models or play with designs as you work through problems and opportunities.
How to use them:
- Try turning your physical whiteboard into a storyboard to work through a business idea or prepare for a process design. You can assemble rough thoughts or stages on colored sticky notes and move them around your board to help you see what may or may not work.
- Try turning your digital whiteboard into an idea board by combining all your ideas into a visual collage. You can add, subtract, or reorder your images until you find the best sequence to help you write a book, structure a screenplay, or plan and teach a lesson.
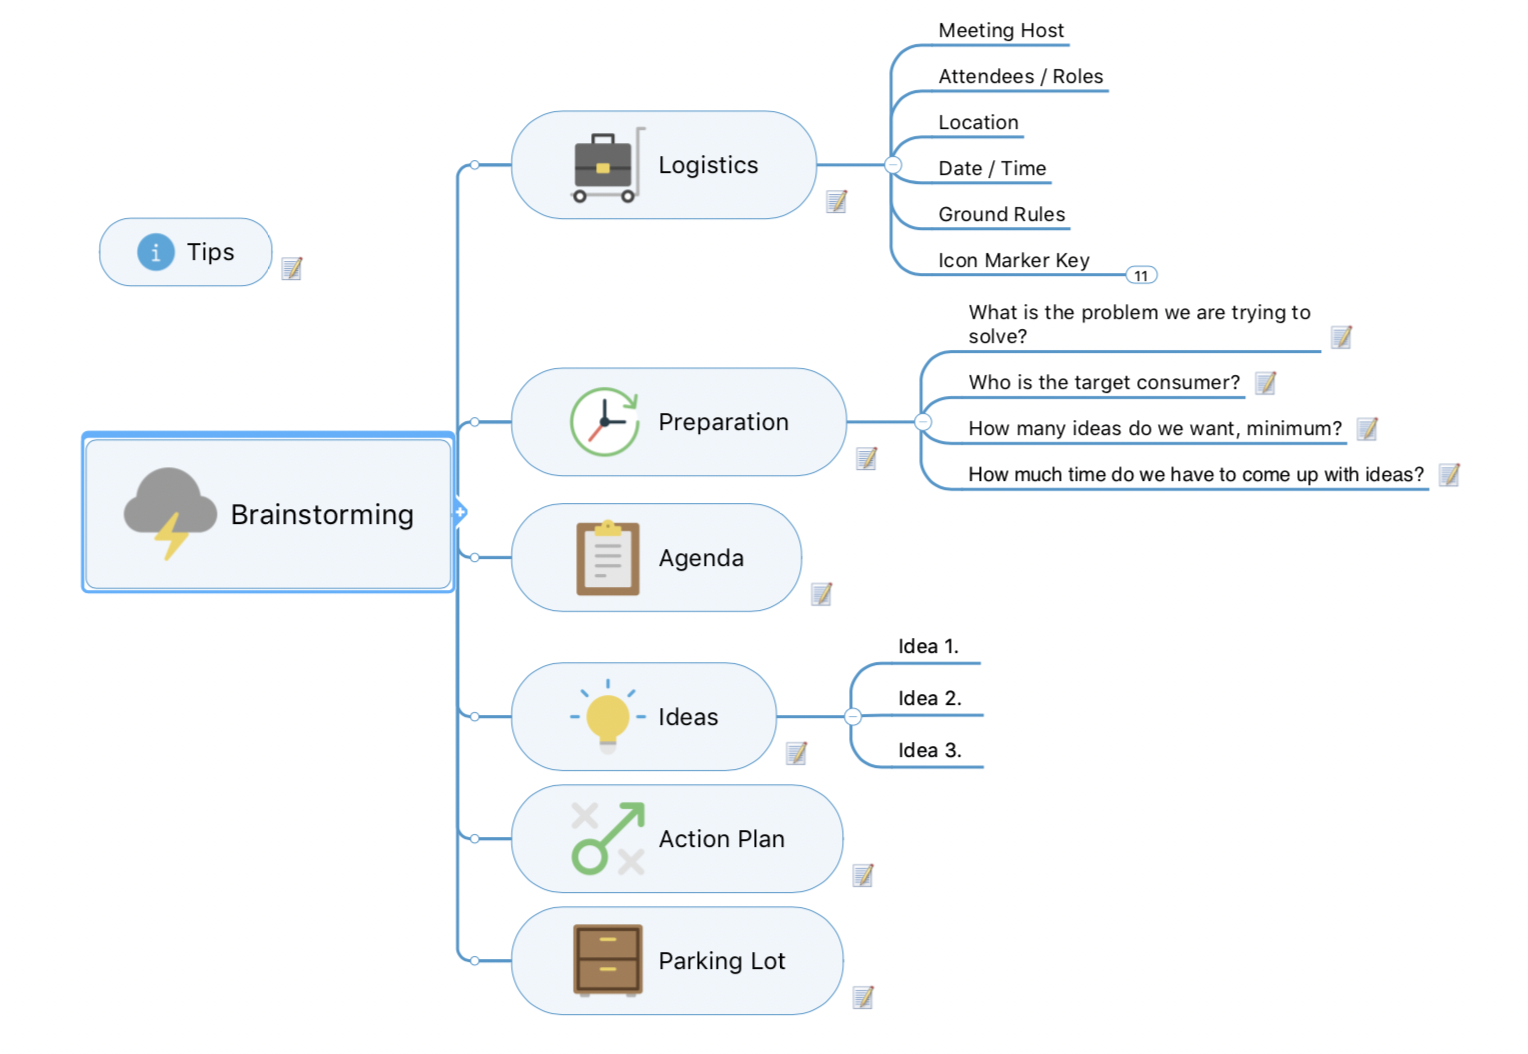
Below is a screenshot of a virtual brainstorming template that was created using MindManager®:
2. Infographics and empathy maps
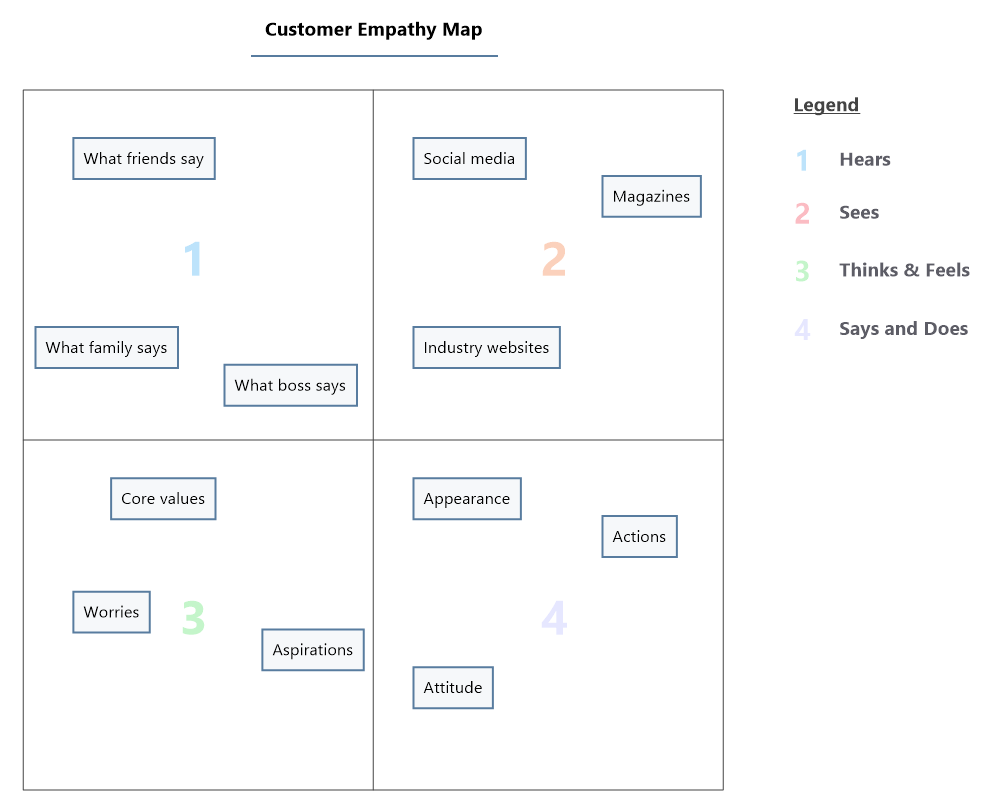
Infographics are colorful, visual representations of data or knowledge that present key information clearly and succinctly. An empathy map, meanwhile, is a simple, collaborative visualization that shows what you know about a particular type of user or customer.
How to use them:
Because both tools improve understanding and outcomes, you can use infographics and empathy maps together to improve a product or process. By combining data and other practical information about a topic or system with profile views of behaviors and attitudes, you’ll gain powerful, empathetic insight into the needs of your customers or users.
Below is an example of an empathy map created using MindManager:
3. Organizational (org) charts
As simple connection diagrams, relationship maps visualize the associations that make up our personal, community, or professional networks and show where their needs or interests align.
How to use them:
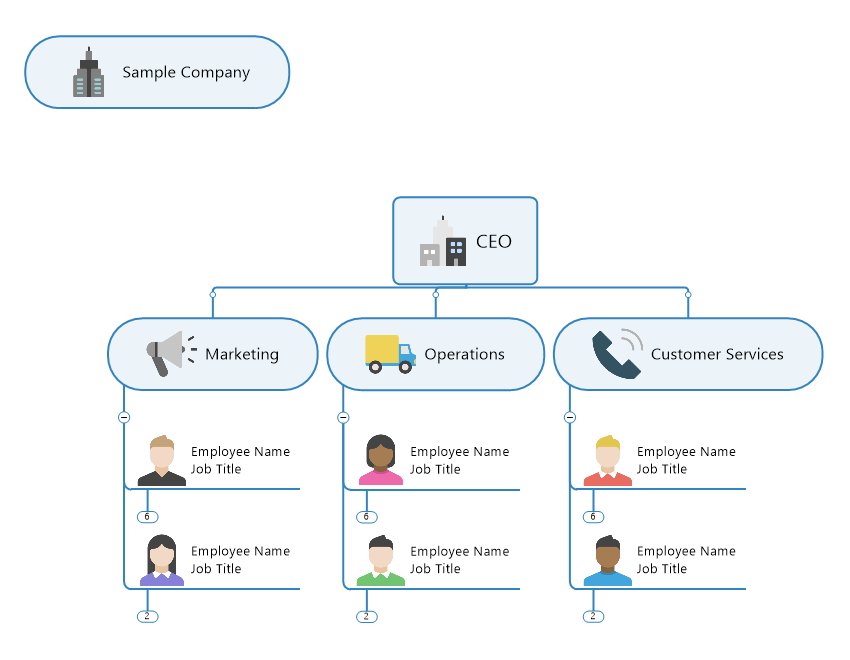
Org charts are especially helpful for understanding company relations and for mapping out interactions and lines of communication. They’re a great tool when you need to onboard a new employee or describe your business or charity to an investor or funder.
Below is an example of an org chart template created using MindManager:
4. Kanban boards
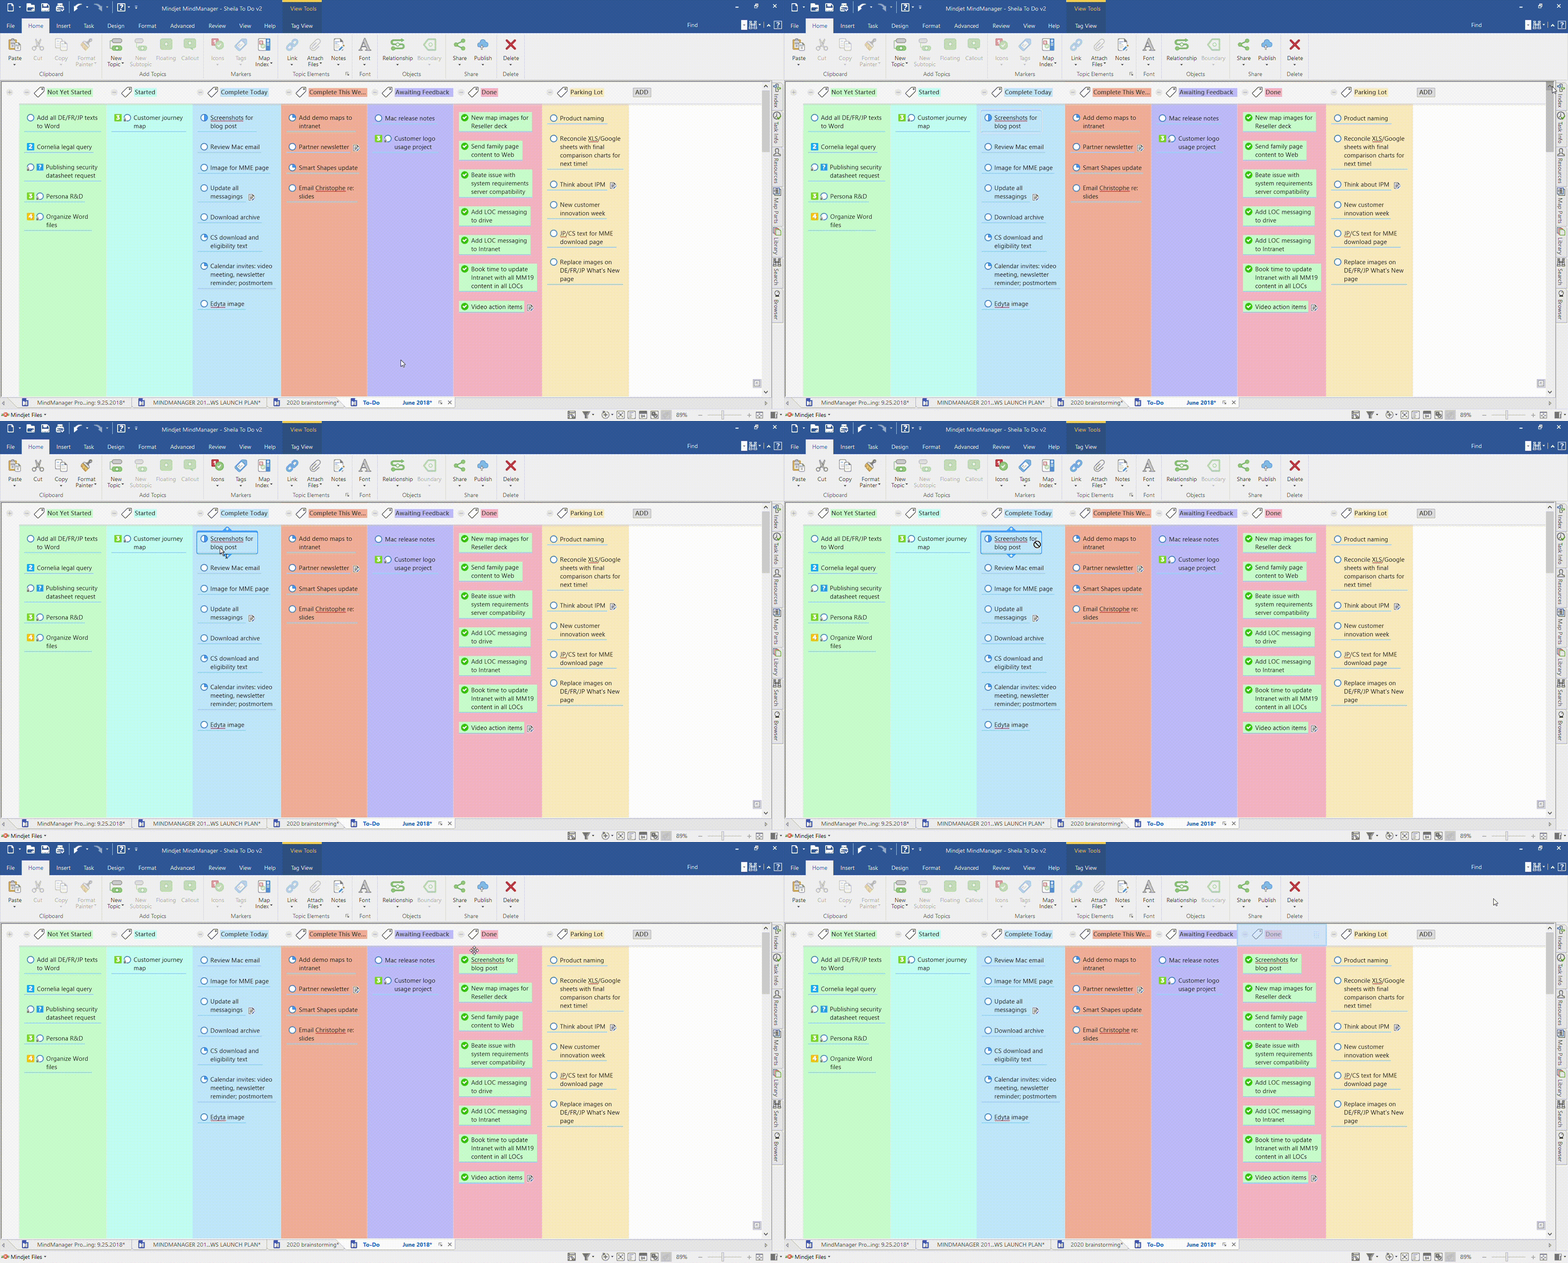
Kanban boards display specific work procedures by using cards (or sticky notes) to represent tasks or activities, and columns to depict each stage in a process. They’re especially useful for working in groups because they make it easier for the actions assigned to various people to align and integrate over time.
How to use them:
You’re not just limited to using a Kanban board to help implement Kanban as a methodology. You can also use it to manage personal tasks or streamline your project management role.
5. Interactive diagrams and charts
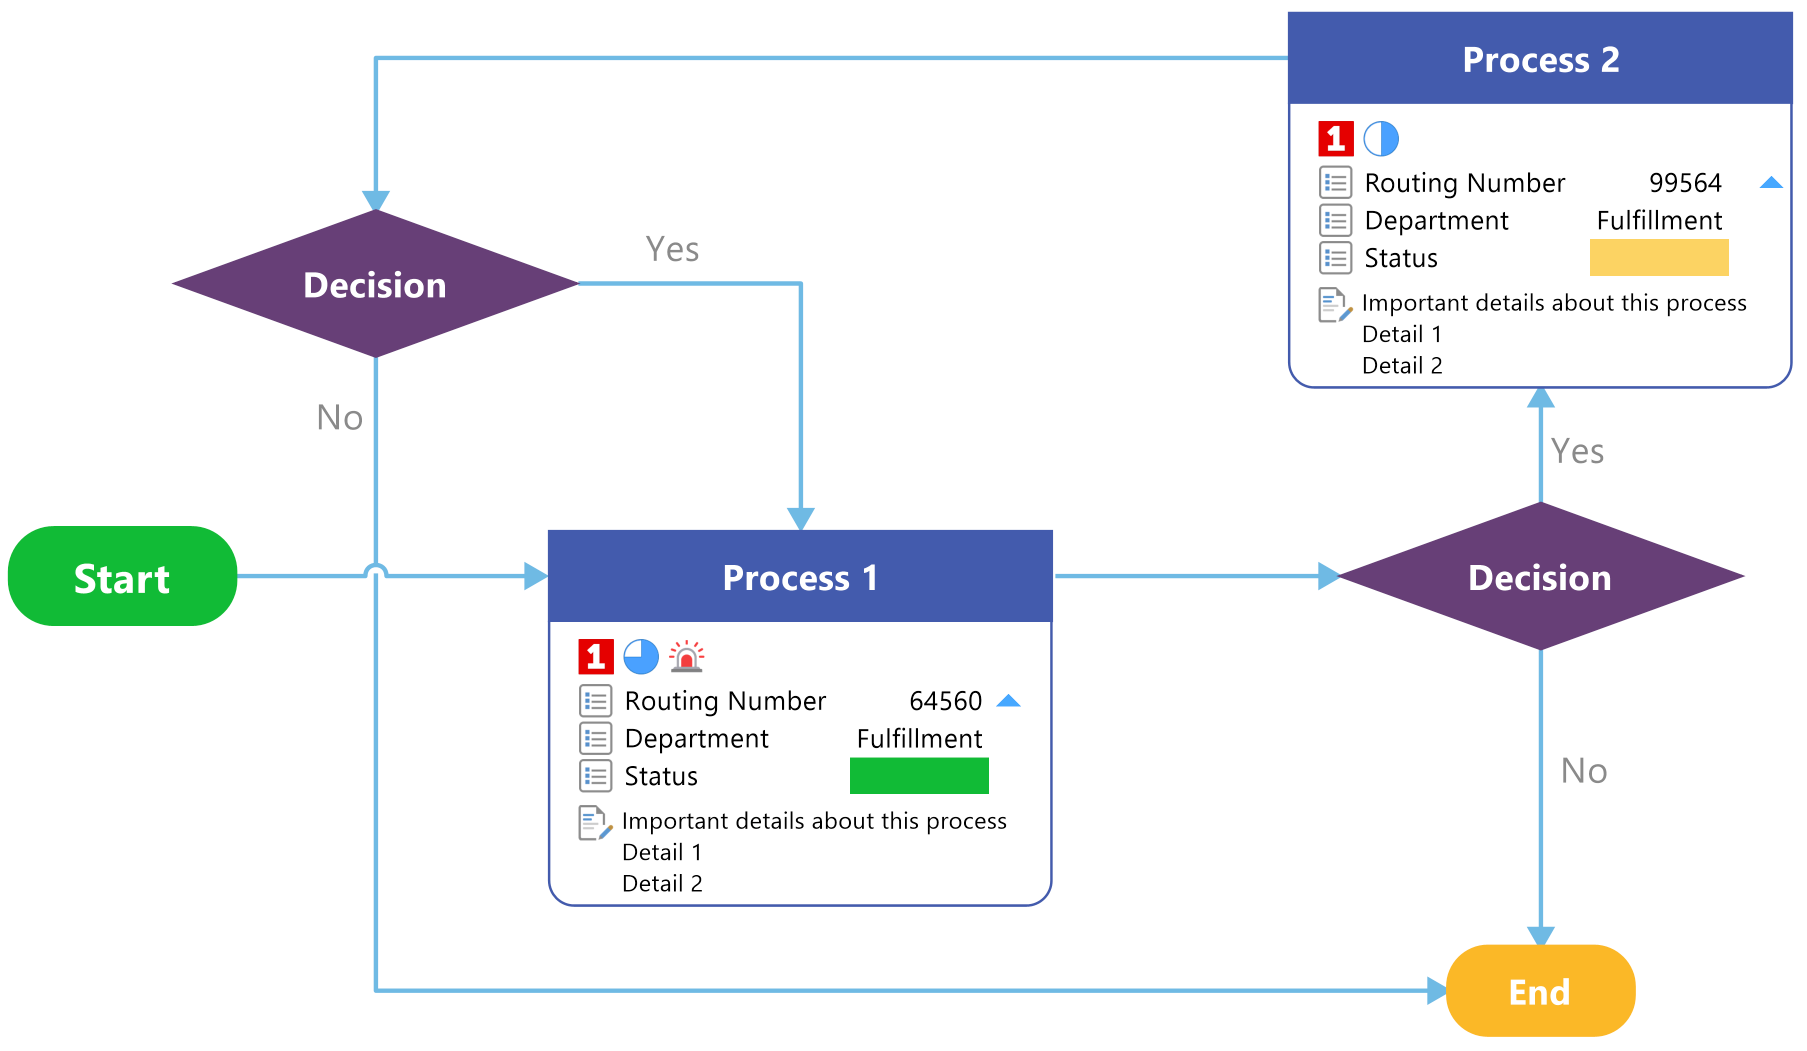
Visual by design, diagrams and charts come in all shapes and sizes. With the help of colors and icons, process diagrams like flowcharts, for example, are frequently used to illustrate the steps in a business process. Schematic diagrams like timelines and Gantt charts, meanwhile, are versatile scheduling tools.
How to use them:
Because they instantly make information more memorable and user-friendly than words or written instructions alone, both flowcharts and Gantt charts are project management staples. You can also count on visual thinking tools like these to boost team engagement and attentiveness.
Below is an example of a flowchart template created using MindManager.
6. Visual maps
You can’t beat visual maps when you need to brainstorm an idea, plan a project, construct a timeline, or outline a strategy. In MindManager software, pre-built visual map templates make it easy to get started using and developing visual thinking. Visual maps of all types are ideal for laying out your vision in one dynamic view. You can even add related files or media to your maps from across sites, apps, platforms, and people.
How to use them:
- Mind maps help you think more creatively, either alone or in a group. Because they encourage free-flow thinking – without the need to worry about order or structure – they make it easier to visually construct and make sense of the notions and ideas floating around in your head. Try using a digital, shareable mind map when you need to create a story, hash out some cost-saving ideas, or troubleshoot a glitchy product or service.
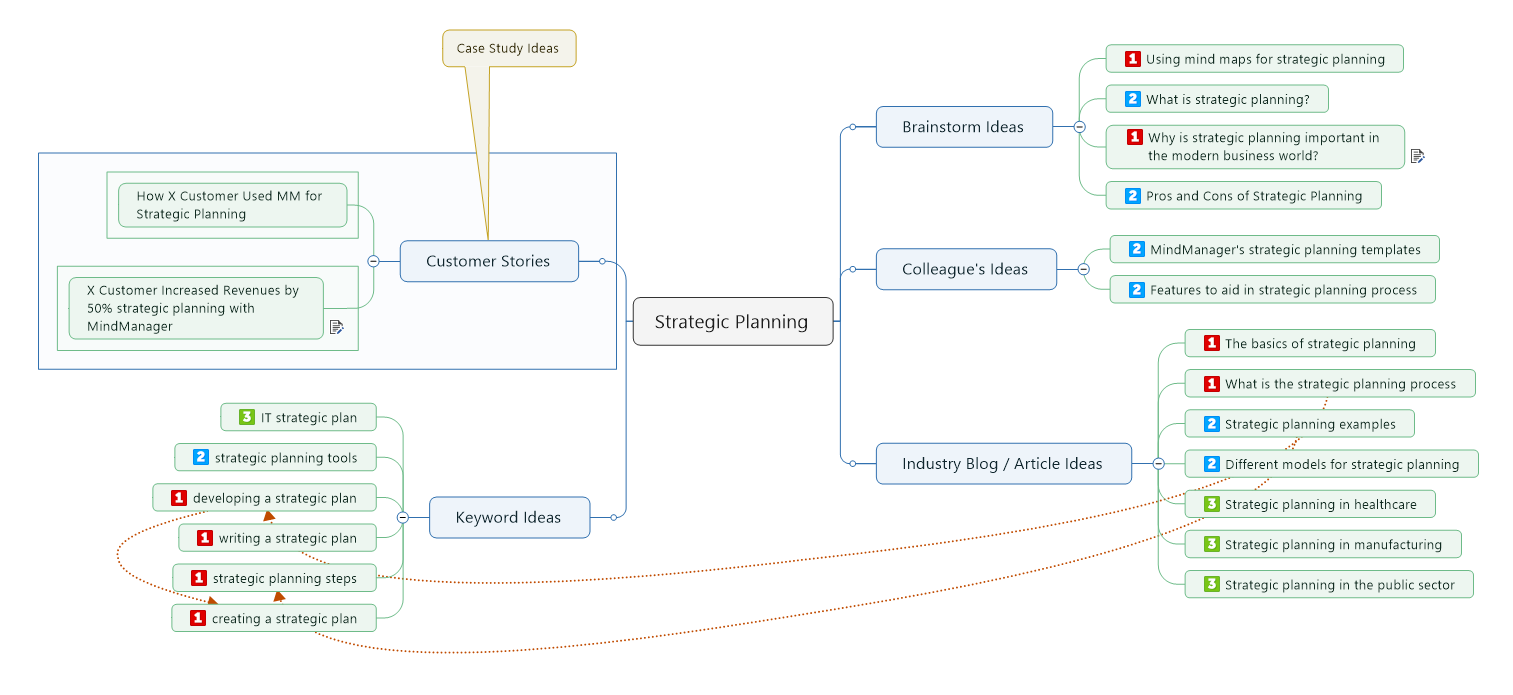
- Idea maps help you structure information more effectively by laying out your thinking process as a series of interconnected ideas. Beyond their brainstorming applications, these simple-to-use planning tools make it easy to organize your thoughts in ways that don’t rely on traditional note taking. Idea maps are great for sharing and remembering complex information. You can use them for everything from creating a handbook, to collaborating over a new product or process design.
Below is an example of an idea map created using MindManager:
Remember: Visual thinking is not about artistic ability. It’s about using visual tools to bring your ideas to life and share them with others.
You can use visual thinking tools like the ones built into MindManager to reduce complexity in information and systems, see problems from a whole new perspective, and create greater engagement among your team members.
No matter which visual tools you choose to work with – and how you choose to use them – thinking and communicating visually will help you process and organize information more effectively, see the big picture and little details at the same time, and bring structure and clarity to your next plan or project.


