
In today’s day and age, information overload is a constant challenge. The need for clear and concise ways to present complex ideas has become more important than ever.
Flowchart diagrams have emerged as a powerful tool to simplify ideas, streamline workflows, and improve understanding.
Studies have shown that visual aids, such as flowchart diagrams, can improve comprehension by up to 400% compared to text-only explanations.
Are you an entrepreneur, a student, or a professional seeking to enhance your problem-solving and decision-making skills?
If so, this blog will provide you with everything you need to understand flowchart diagrams and how to utilize them.
What is a flow chart?
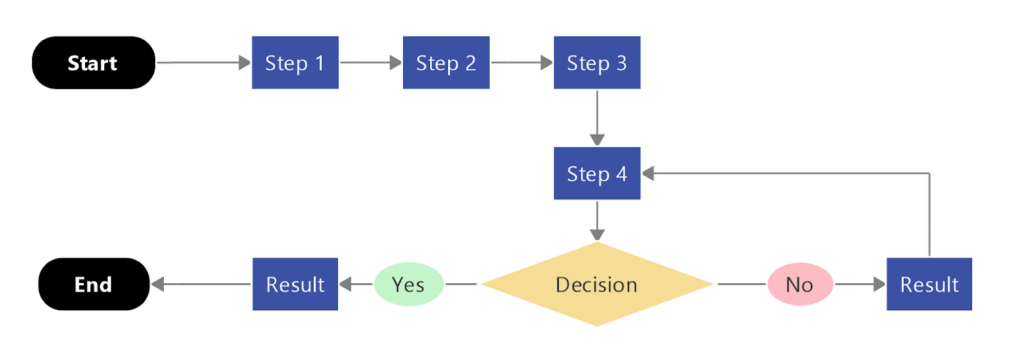
Flowchart diagrams are visual representations that help show the steps and decision-making processes of a system, concept, or procedure.
They use symbols and arrows to show the flow of information or actions, making complex processes easier to understand.
A flowchart consists of shapes connected by lines, each representing a specific action or decision.
The shapes typically used in flowcharts include rectangles, diamonds, ovals, and parallelograms. These shapes are chosen based on the specific purpose of the flowchart and convey different meanings.
By visualizing these steps sequentially as a series of text-filled symbols or shapes, flowcharts can show you:
- How to reach your goal, step-by-step.
- What tasks need to be completed as part of the process.
- Where decisions need to be made, and what happens next.
Flowcharts make it easier for teams to follow work processes. They’re a powerful alignment tool that can be used to help you create, document, analyze, or improve the way work gets done.
A brief history of flowcharts
Flowcharts have a long history. They have been widely used for decades in various fields to visualize processes and workflows.
The concept of visualizing processes using graphical symbols can be traced back to ancient civilizations, such as the Egyptians and Greeks. They employed diagrams and drawings to represent organizational systems and workflows.
In the modern context, the credit for creating and popularizing flowcharts can be attributed to Frank Gilbreth and Lillian Gilbreth, pioneers in the field of industrial engineering.
In the early 20th century, the Gilbreths introduced a system called “Process Charts” to analyze and improve workflow efficiency in industrial settings.
These process charts utilized symbols and arrows to depict the flow of materials and information in a process.
However, it wasn’t until the 1940s that the concept of flowcharts gained actual popularity. During this period, flowcharts became an essential tool in computer programming as they helped programmers visualize and understand complex algorithms and programs.
Over the years, flowcharts have evolved. Now, many symbols have standard meanings to ensure consistency and clarity, such as:
- Rectangles used to show processes.
- Diamonds to portray decisions.
- Oval shapes pinpoint the start or end of a flowchart.
- Parallelograms to represent input/output or data storage.
- Arrows for workflows and more.
In the present day, flowcharts are widely used in diverse industries. They enable teams and stakeholders to understand, analyze, and communicate complex processes, identify issues, and find solutions for improvement.
How to use a flowchart
You can use a flowchart template to solidify personal or team objectives across various business activities. They’re often the tool of choice for explaining complex procedures without the technical jargon.
Here are a few flowchart examples outlining areas where these step-by-step diagrams come in especially handy:
- Project management and planning. Starting a project? You’ll find flowcharts an invaluable aid – especially during the planning stage. Use your diagram to ease collaboration between individuals or departments as you map out the steps your team needs to take.
- Program, product, or system design. Designing something new comes with a unique set of challenges. Using a flowchart diagram can help level the playing field when your group is venturing through uncharted territory together. For example, when you’re tasked with creating a great user experience design.
- Workflow documentation. Documenting a workflow or process with the help of a flowchart maker gives you a visual, readily available point of reference. This may help you get inspired, discuss a problem, make improvements, demonstrate compliance, or share knowledge with a new hire.
- Process audit and decision-making. Troubleshooting, cost-cutting, and efficiency initiatives are all made easier by using flowcharts to study your options. Decision flowcharts (aka decision tree diagrams) are just one example of how you can review failed or inadequate processes from different angles.
2 types of flowcharts
There are various types of flowcharts and each type serves a different purpose and is used in different industries and fields.
Below are three types of flowcharts that may be useful to improve your workflow:
Type 1: Process map
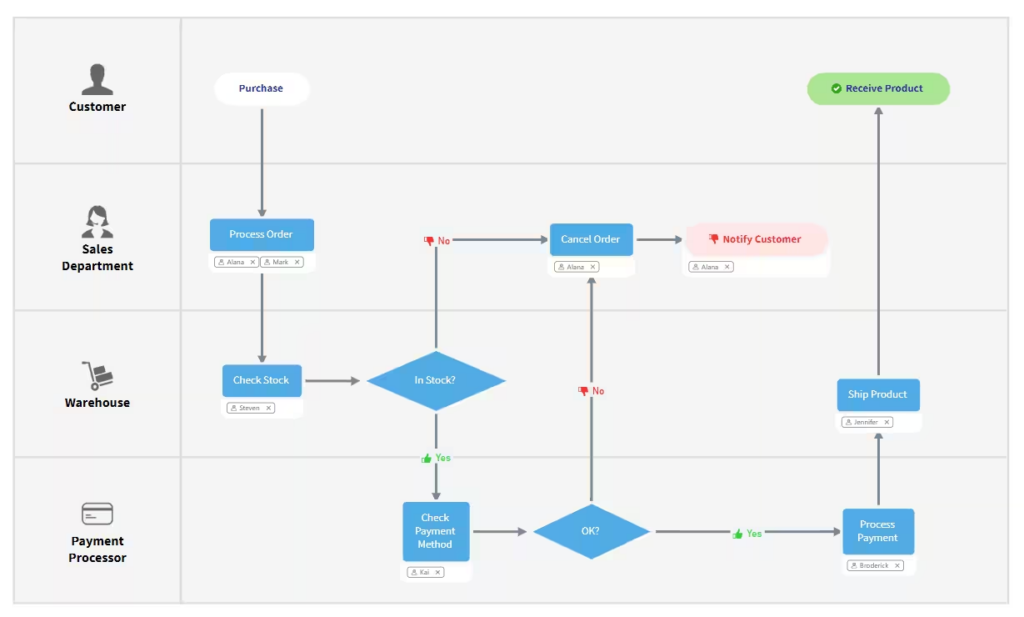
A process map is the most commonly used type of flowchart. It illustrates the steps or actions in a process, showing the sequence of tasks and decision points.
Process maps are used to analyze and optimize business processes, identify issues, and communicate the process to stakeholders or higher-ups. They are widely used in various industries, such as manufacturing, logistics, healthcare, and project management.
Type 2: Decision flowchart
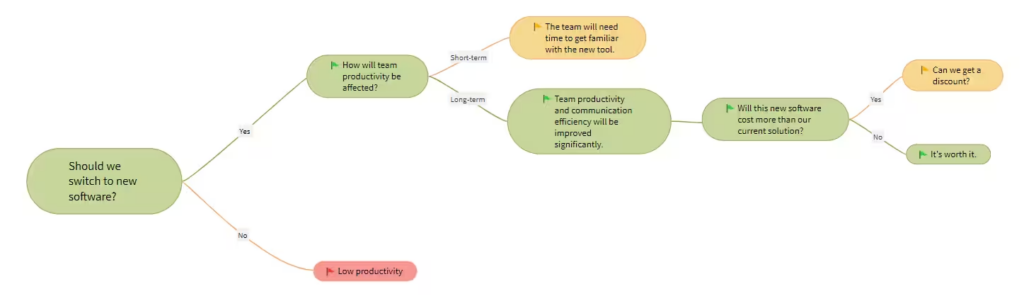
A decision flowchart, also known as a decision tree, represents a series of decisions and their possible outcomes. It visualizes the logic flow, allowing users to make decisions based on certain conditions or criteria.
Decision flowcharts are commonly used in problem-solving, algorithm design, and decision-making processes across many fields, including programming, finance, and quality management.
6 flowchart symbols to use in your diagrams
In flowcharts, symbols represent different elements and actions involved in a process. These symbols provide visual clarity and help to communicate the flow of the process.
These symbols interact with each other in a flowchart by connecting them with arrows that indicate the sequence of steps or actions. Arrows show the flow direction from one symbol to another, indicating the order in which the actions or tasks are performed.
The flowchart continues until it reaches the end symbol.
Symbols can be connected through multiple arrows, branching out to different paths based on decisions, or connecting back to previous steps to represent loops. The specific interaction between symbols in a flowchart depends on the representation process’s logic and requirements.
Here are some common symbols used in flowcharts:
1. Start and end symbol
This symbol is represented by a rounded rectangle and signifies the beginning or end of the
process. It is used to indicate the start and end points of the flowchart.
2. Process symbol
This symbol is represented by a rectangle and represents an action or operation that occurs within the process. It is used to describe the specific tasks or actions that need to be carried out.
3. Decision symbol
This symbol is represented by a diamond shape and is used to present a decision point or branching in the process. It represents a yes/no or true/false condition and usually has arrows pointing to possible outcomes.
4. Input and output symbol
This symbol is represented by a parallelogram and represents the input or output of data or information to or from the process. It signifies the interaction with external sources or systems.
5. Connector symbol
This symbol is represented by a small circle or a small rectangle and is used to link different parts of the flowchart. It is used when the flow needs to continue on a different page or when it needs to reference another part of the flowchart.
6. Loop symbol
This symbol is represented by a curved arrow or rectangle with curved sides, indicating a loop or repetition. It signifies that certain actions or tasks are repeated until a condition is met.
9 steps to plan your flow chart
Planning a new flow chart involves several key steps.
Here are the steps presented as bullets:
- Define objectives. Clearly outline the purpose and goals of the flow chart and identify what process or system the flow chart will represent.
- Identify processes and activities. List the main processes and activities that need to be represented in the flow chart. Then, break down complex processes into smaller, manageable steps.
- Determine flow direction. Decide the flow direction (usually left to right or top to bottom).
- Use standard symbols. Choose appropriate flow chart symbols for different elements such as processes, decisions, inputs, outputs, etc.
- Define start and endpoints. Mark the start and end points of the process and indicate where the flow chart begins and where it concludes.
- Establish connections. Connect processes and activities with arrows to represent the flow of information or actions.
- Include decision points. Identify decision points within the process where choices need to be made and use decision diamonds to represent these decision points.
- Get feedback. Share the flow chart with relevant stakeholders to gather feedback. Incorporate suggestions and make improvements accordingly.
- Finalize and document. Finalize the flow chart with the necessary adjustments.
How to create a flowchart diagram in 4 steps
Since the point of any flowchart is to clarify a process or flow of events, standardized symbols are the key to communicating in a “language” everyone will understand.
As mentioned, the three most basic flowchart symbols include:
- Oval shapes (indicate workflow start or endpoints).
- Rectangle shapes (indicate individual steps).
- Diamond shapes (indicate decision points).
Here’s how to create a flowchart diagram in four easy steps.
1. Establish the purpose of your flowchart
List out the various steps you’ll need to include.
2. Use a labeled oval shape to represent the starting position of your process or workflow
Then, with the list you just created, start at your oval and use arrowed lines to link the individual steps or tasks in the proper sequence. These steps should be represented by rectangles with brief, text-based descriptions inside.
Use diamond shapes to indicate where decisions will be required in your process
Use arrowed lines to link each diamond to new or repeated steps resulting from your decisions.
Use a labeled oval shape to represent the end of your process or workflow
And that’s it!
Example of a flowchart diagram
No matter how you use it, you’ll find a flowchart diagram equally effective, whether driving or supporting your initiative.
Here’s a very simple example.
Let’s say you and a friend want to create, stock, and sell originally designed t-shirts. Neither of you has run a business before, however, so you’re having trouble visualizing what the customer order process will look like.
Since you need to finalize this part of your business plan before your bank loan appointment tomorrow, your friend suggests using a flowchart diagram to get a handle on your sales order workflow.
You start by listing the steps you expect to take as part of this process.
- Your customer places an order.
- You pick the requested shirts from your inventory and set them aside.
- You process your customer’s payment.
- You package and ship their order.
- The receipt of their delivery is confirmed.
- You follow up to make sure your customer is satisfied.
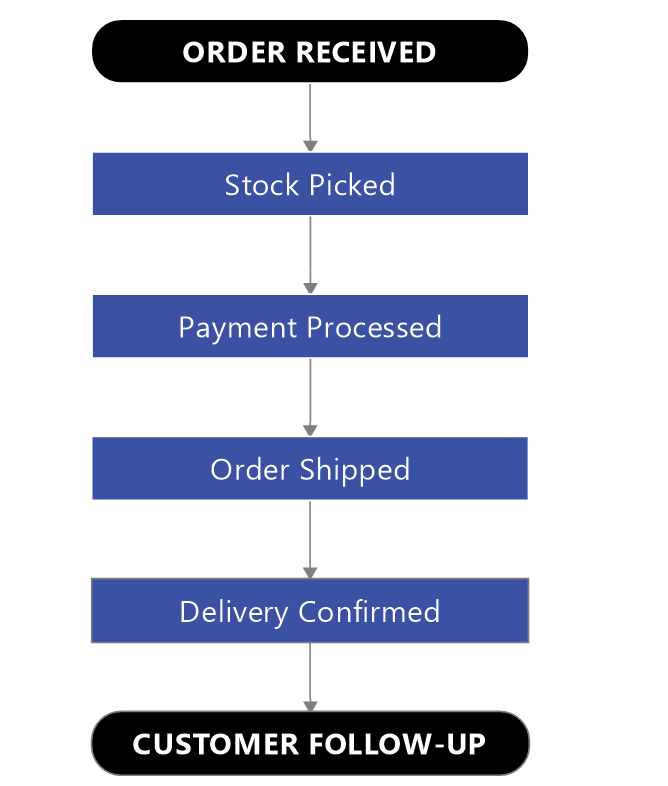
Next, you lay these steps out in your diagram using directional arrows and the appropriate flowchart symbols (in this case, ovals and rectangles).
ORDER RECEIVED (process start point) > Stock picked > Payment processed > Order shipped > Delivery confirmed > CUSTOMER FOLLOW-UP (process end point)
So far, so good. Here is what your simple flowchart would look like:
You’re smart enough to realize, however, that t-shirt inventory levels will fluctuate, and not every customer payment transaction will clear.
So, you identify where decisions will need to be made and use diamond shapes to edit and restructure your flowchart at two distinct points.
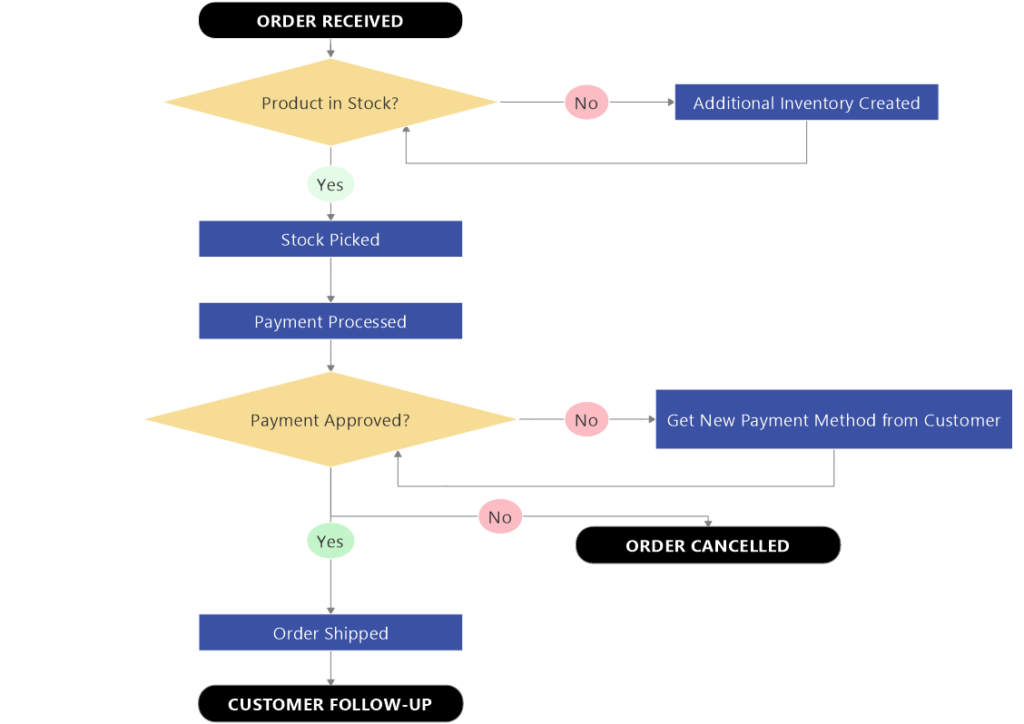
H3: Point #1
ORDER RECEIVED (process start point) > Product in stock?
YES > Stock picked > Payment processed …
NO > Additional inventory created > Product in stock?
YES > Stock picked > Payment processed …
H3: Point #2
ORDER RECEIVED (process start point) > Stock picked > Payment processed > Payment
approved?
YES > Order shipped …
NO > Get new payment method from customer > Payment processed > Payment approved?
YES > Order shipped …
NO > ORDER CANCELLED (new process endpoint)
To design this process as clearly as possible for the benefit of both you and the bank, label the arrowed lines branching off your diamonds with the words YES or NO. Then, connect them to new rectangles or back to previous rectangles when earlier steps must be repeated.
Following those steps, here is what your new flowchart would look like:
Now, feeling much more confident about how your customer order process will play out, you finish your business plan, keep your bank appointment, and get the loan you need to start cranking out t-shirts.
3 flowchart use cases
Flowcharts are so versatile, we’re confident you’ll have no trouble finding ways you, your team, and your company can use and benefit from them – especially when you need to:
- Lay out the processes for creating new products or systems.
- Explore areas where quality or efficiency might be improved in an existing workflow.
- Visualize the tasks or decisions that will go into planning your next project.
If you need more help getting started, here are some additional flowchart examples in the form of use cases.
1. Company A wants to improve its approach to sales training
With sales department turnover high – and exit interviews showing departing reps weren’t always confident in their ability to close a sale – the company realizes they need to provide new sales hires with better training.
They use a flowchart diagram to document their sales process from beginning to end and use it as the central talking point in onboarding sessions going forward.
As the company’s sales rep performance improves, turnover goes down, and revenues go up.
2. Company B wants to create a simple but effective set of product instructions
Despite its popularity, surveys show that many customers find the company’s flagship product difficult to assemble and operate.
Determining they need instructions to simplify these processes for future buyers, the company prints flowchart diagrams that illustrate product assembly and troubleshooting procedures step-by-step.
By providing these instructions with their product, the company soon finds they’re spending less time on after-sales support.
3. Company C wants to customize its service
The company has experienced great success with their basic house-cleaning service but receives many requests for add-ons like window washing and upholstery cleaning.
Recognizing that customized packages will necessitate additional time, equipment, and staff, the company uses flowcharts to lay out revised workflow options and determine cost feasibility.
Ultimately, they discovered that customizing their service isn’t financially viable right now.
The company decides to put customization on hold until they’ve explored opportunities for outside investment.
Flowcharting with MindManager
Visualizing processes or workflows is essential for effective project management, and MindManager® provides the perfect solution with its user-friendly flowcharts.
Whether you’re streamlining tasks, planning projects, or enhancing team collaboration, MindManager’s flowchart capabilities make the process seamless and efficient.
The intuitive interface allows you to easily create, customize, and analyze flowcharts, empowering you to visualize complex information with clarity. MindManager enables you to explore its features and integrate them into your workflow.
Take the first step towards enhanced productivity and better project outcomes by harnessing the power of MindManager’s flowcharts – start your free trial today!