By: Leanne Armstrong
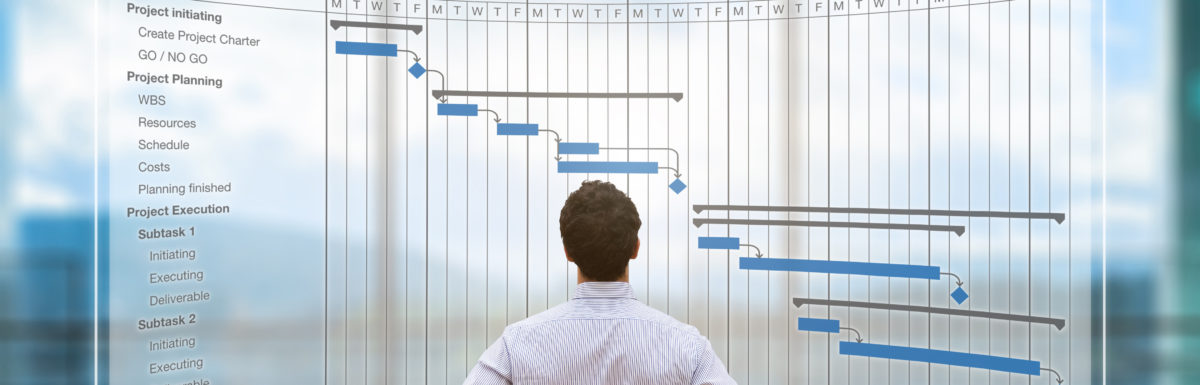
You may have noticed we mention Gantt charts a lot. And you likely get that they’re pretty useful work management and scheduling tools. But because Gantt charts can look a little daunting at first glance, not every project manager is as familiar with them as they might like to be. Gantt chart project management is actually one of the most effective ways to organize and track multiple activities over the course of your project.
And since we think everyone should have the opportunity to benefit from using these interactive diagrams, we’ve put together a primer on what makes Gantt charts such valuable task management tools – and how you can start taking advantage of them in all your work projects.
[Free eBook] The Ultimate Guide to Visual Project Planning
How Gantt charts are used in project management
The Gantt chart we use today was originally created by American engineer and project management consultant Henry Gantt in the early 1900s. His was a straightforward design for keeping work organized: horizontal lines across a bar chart show which activities need to be accomplished, and when.
By using a Gantt chart for project management, you can quickly see the start date and end date of your mission, as well as all the work that’s scheduled in between.
Here’s how it works in a nutshell:
- The various tasks associated with your project are listed down the left side of your Gantt chart, and your project schedule is laid out across the top.
- A horizontal line (or bar) is used to represent each task so that its start date, end date, and duration are clearly displayed.
Simple, right?
Of course, Gantt charts have come a long way since Henry’s time. And there’s a whole lot more to them in terms of making projects of any size run more smoothly.
For example, not only have these scheduling tools moved off the printed page and on to our computers, digital Gantt chart project management has become invaluable for:
- linking, modifying, and sharing project activities,
- adding task constraints, and
- managing project resources
Many of today’s business professionals rely on versatile project management software like MindManager for working with Gantt charts.
Let’s find out why.
The benefits of using Gantt chart project management software
When you prepare a project timeline manually, every change in your assignment means waiting for task amendments to be made and schedules to get recreated.
Spreadsheet tools are a big improvement over text-based timelines and to-do lists. But they still tend to bog projects down and stifle collaboration because:
- setting up task dependencies for large-scale projects can be complicated,
- certain types of modifications can’t be automated, and
- not every team member has advanced spreadsheet skills
Map-based Gantt chart software is quickly becoming the go-to timeline tool for project management because it’s so interactive and easy to use.
When work is broken down visually, no special skills are required to keep track of what’s finished and what still needs attention. So digital Gantt chart project management not only makes it easier to collaborate, it delivers better outcomes.
Let’s say your project requires that multiple team members from various departments all interact with the same schedule.
Instead of struggling to work in a shared spreadsheet file, MindManager’s integrated Gantt chart tool provides a convenient way for everyone to view and update project activities in real time, including:
- who’s been assigned to each task,
- what resources are being used,
- how much work’s been completed on specific activities, and
- the dependency relationships between scheduled tasks (i.e. where they overlap, and how each may rely on another’s progress)
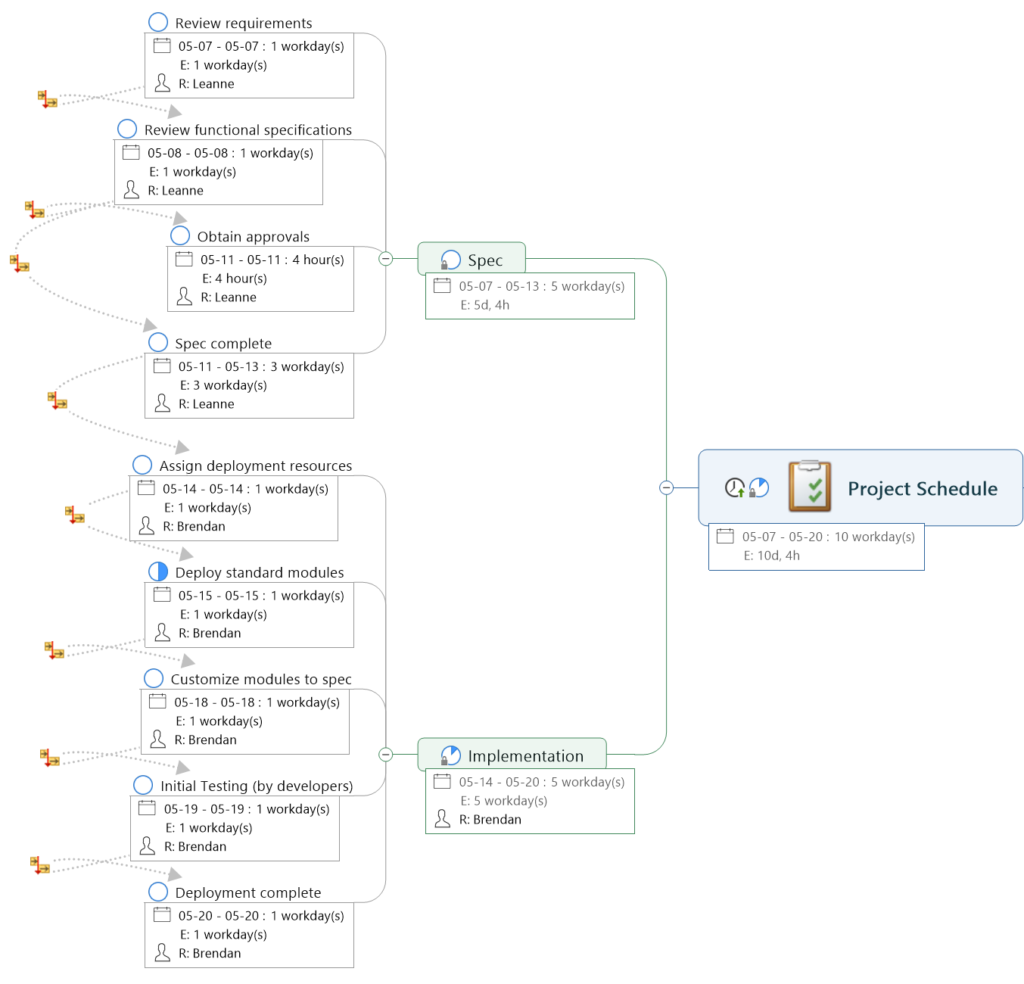
MindManager’s pre-built project management templates helps you with project planning, resource and budget allocation, task assignments, and progress tracking. All of this information can easily be transformed into a Gantt by simply changing views in MindManager.
Here’s a quick overview of how to display a project in MindManager using Gantt charts.
Gantt chart project management in MindManager
MindManager allows you transform your existing project plan or work breakdown structure into an actionable Gantt chart that you can use to track project timelines, critical path, task dependencies, and more.
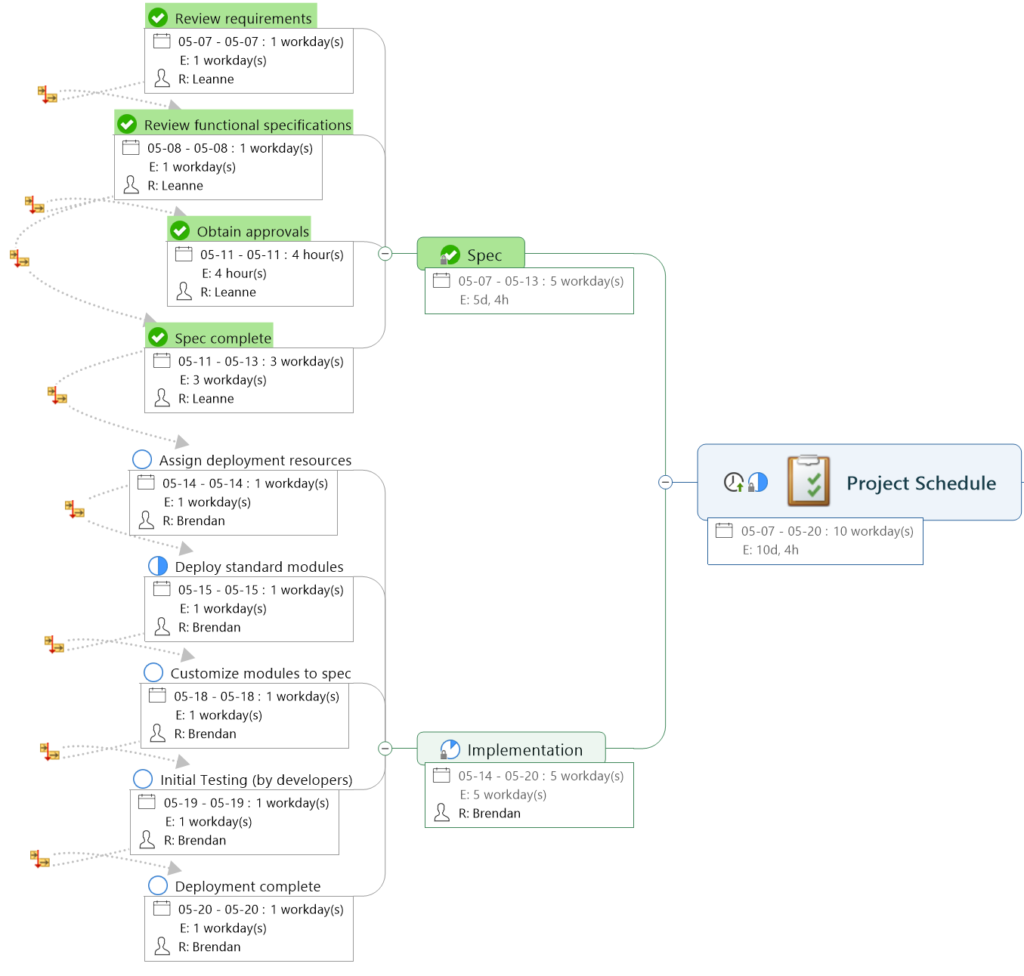
To get started with Gantt chart project management in MindManager, build out your project plan as you would normally. Be sure to include:
- All tasks needed to complete the project.
- Start dates, end dates, and work durations for each task.
- Task assignments.
- Relationships and dependencies between tasks.
- Task status to track completion and percentages.
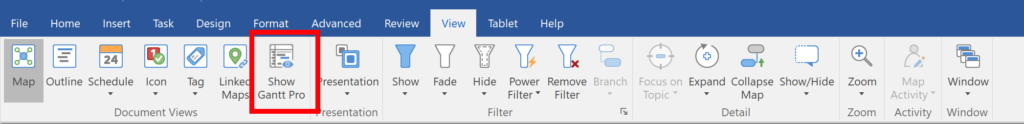
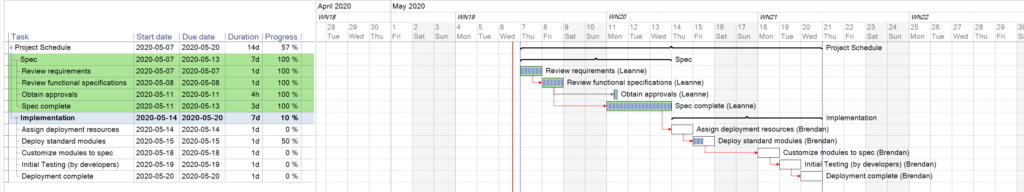
Once you built out your project plan with all relevant information, you can switch to Gantt view by clicking View > Show Gantt Pro in the top ribbon.
You’ll now see your project laid out in a Gantt chart format. Topics and subtopics are shown as tasks and subtasks in the left information bar. You’ll also see Start Dates, Due Dates, Duration, and Progress percentages.
In the Gantt chart itself, task timeframes are visually displayed again a calendar, and show who is assigned each task. The red arrows indicate the critical path for your project.
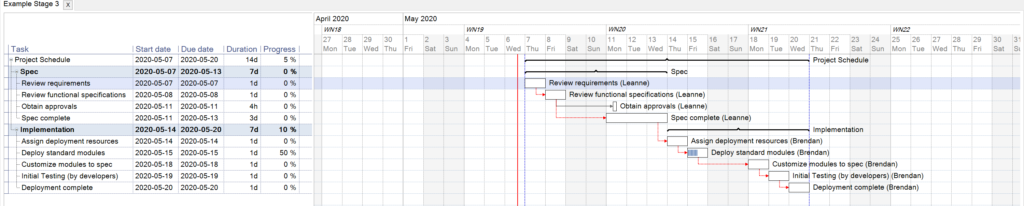
As you and your team complete tasks, you can change the Task Status markers in your map to complete.
These changes will automatically be reflected in your Gantt chart.
This is a very simple overview of what can be accomplished with Gantt chart project management in MindManager. For a more in-depth tutorial on this feature, watch the webinar linked at the start of this section.
Related articles
- Getting back to the basics of project management
- 5 stages of the project management process
- What project management tools should every business be using?
- 7 project management methodologies to kick start your next project
- Your guide to making the most of project management flowcharts
- 5 steps to better project management visualization
 The Ultimate Guide to Visual Project Planning
Download this free eBook to get a primer on the concept of visual project planning, an exclusive Project Planning Visualization Toolkit, and 13 downloadable visual project planning templates to get you started right away!