 As mentioned in our last Interview with a Customer post, we’ve been talking a lot about improving productivity and processes lately. Last post, we spoke with Andy Makar, an IT director, Agile a enthusiast and avid MindManager user to hear how he has boosted his team’s productivity using mind mapping. This week, we will be hearing from Wojciech Korsak.
Wojciech has 10 years of experience as an expert consultant and trainer for various projects and large enterprises. Previously, he worked for four years as an analyst in large international corporations in the financial, pharmaceutical and production sectors. Wojciech is an expert in information mapping, communication using interactive dashboards, analysis, personal and team development and using visual communication. Additionally, he has published a book titled “Visualization of Information in Business” as well as numerous free e-books and guides on visual communications and mind mapping. He was awarded a Mindjet Most Innovative Partner award for Poland in 2008.
Here’s what Wojciech has to say:
Q: In your opinion, what makes mind mapping software an ideal tool for creating personal dashboards?
Wojciech: The key is simplicity. Mind mapping software is very easy to use, so it’s a great opportunity to start managing with mind maps without the steep learning curve. Most people intuitively know how to use it.
Why create personal dashboards? In my opinion, it’s the best way to see the BIG picture as well as the structure of your work details and relationships. You decide how you want to manage your work, and then create a mind map structure that supports it. You create the structure of the map so it is YOUR dashboard tailored to your unique needs. That’s powerful!
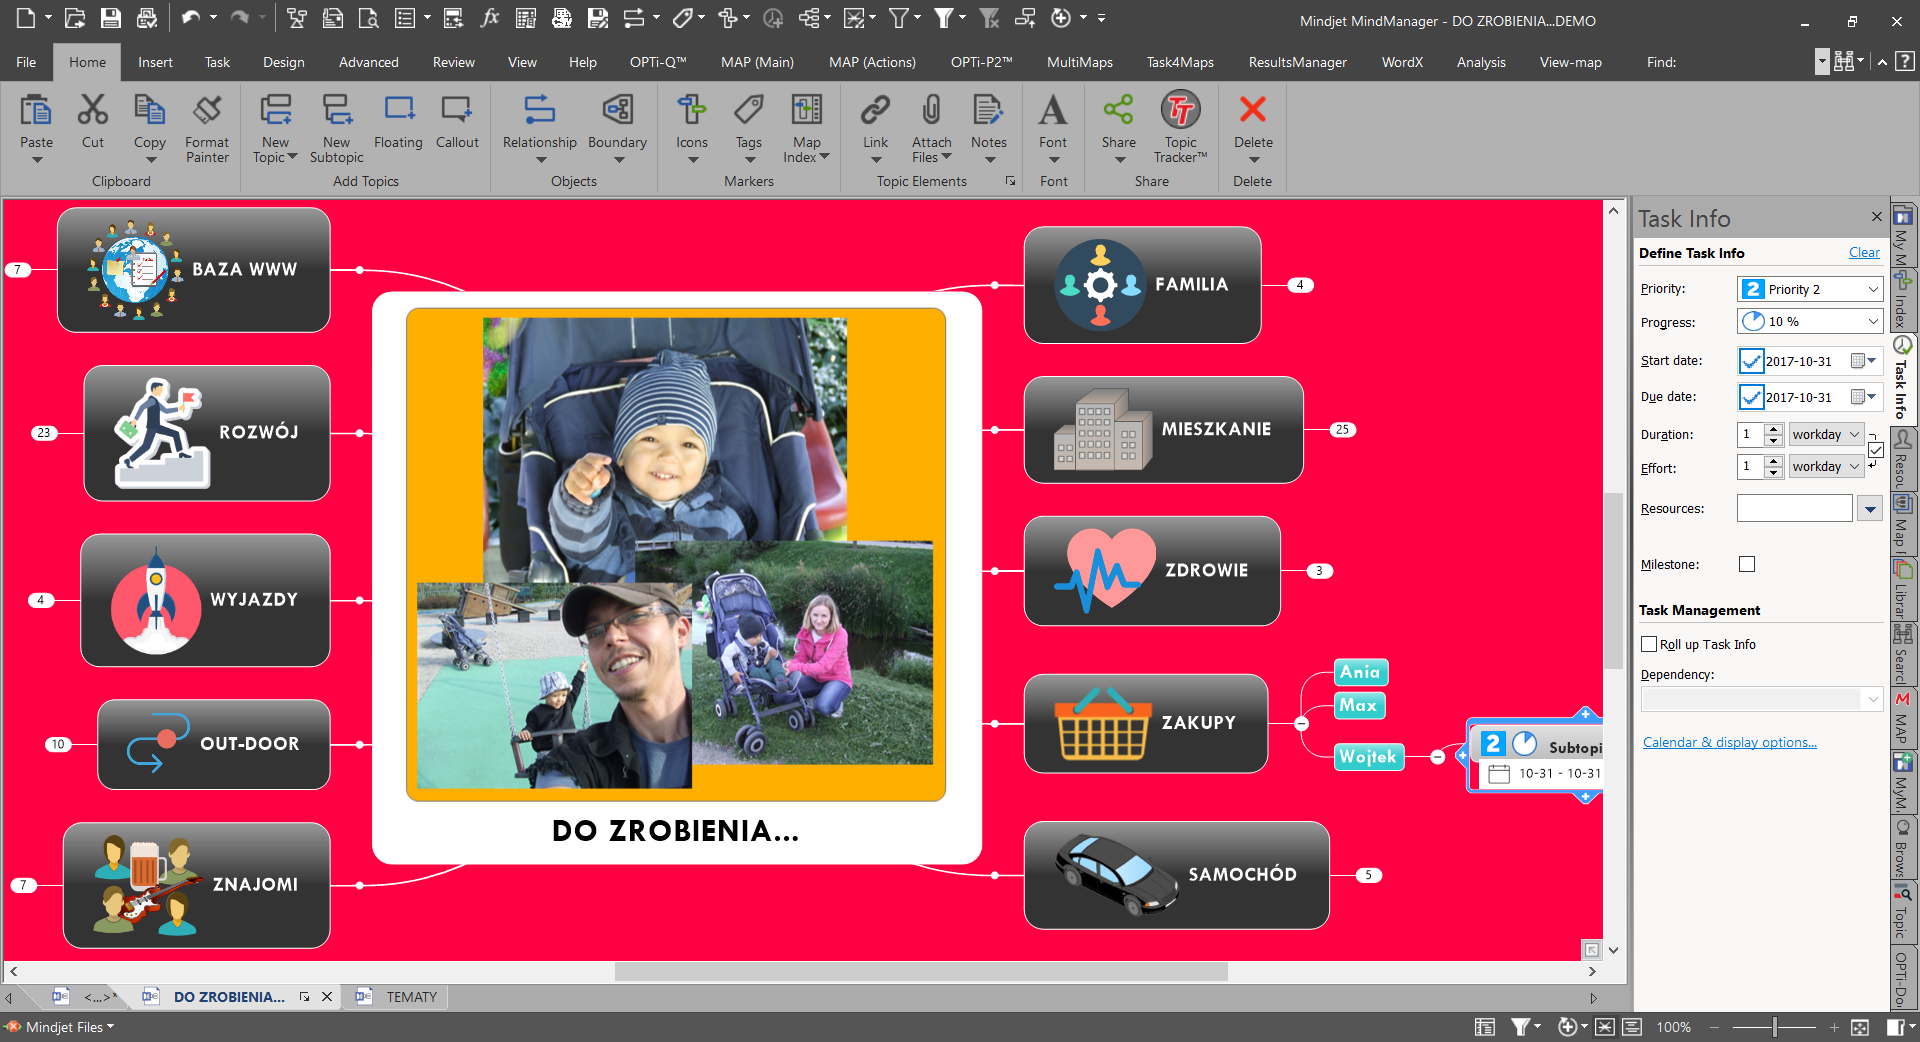
Q: What’s contained in your dashboard mind map? Can you give us a general overview?
Wojciech: First of all I create the main topics – i.e. accounting, marketing, reporting, etc. Then I develop sub-topics. I use MindManager, so I can add many enhancements to topics to help me manage tasks and processes, including:
- Alerts,
- Roll-up functions to see the whole path of the task and its relationships,
- Task information with resources,
- Tags to mark specific elements,
- Icons, which enable me to filter the contents of my dashboard, and
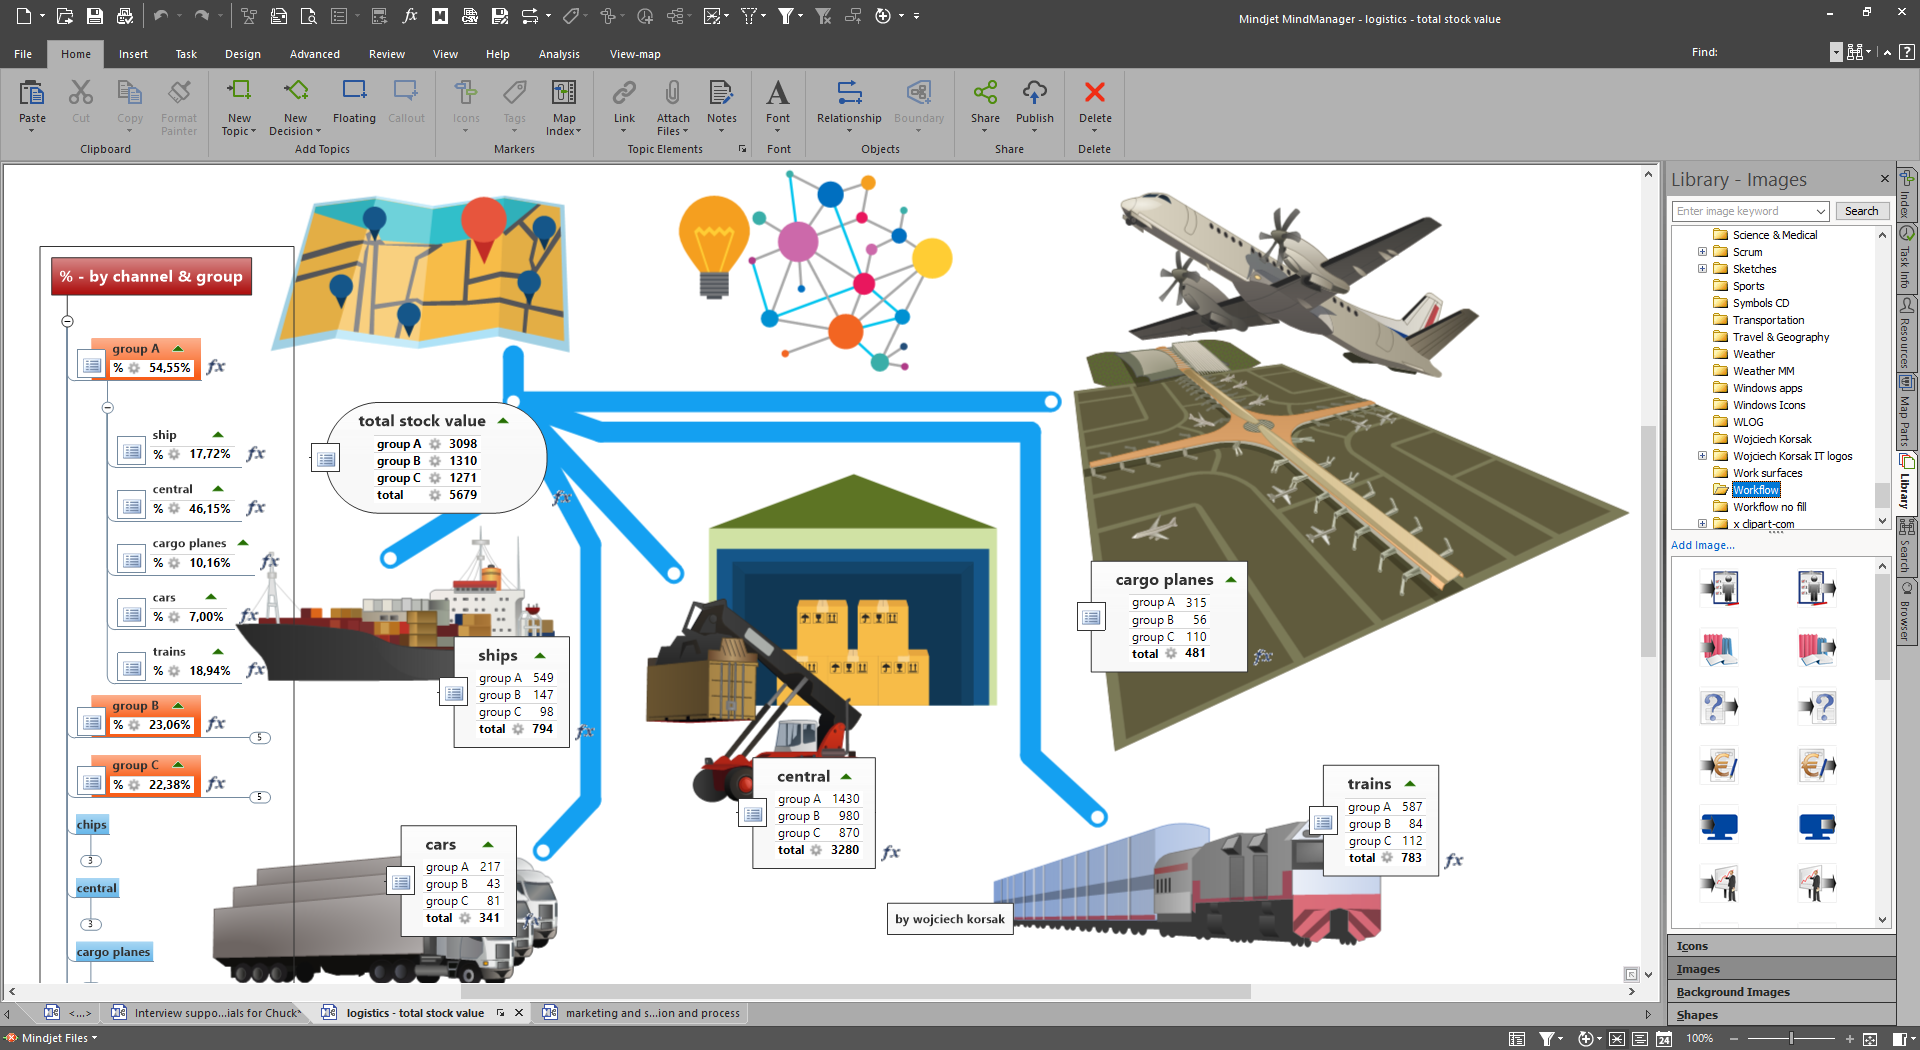
- Internal calculations for financial topics.
I find it’s worthwhile to take the time to add context information like tags and icons to the topics in my dashoard map. It helps me find information faster. I use notes to capture additional information so I can read it when I need to, but otherwise it’s tucked away, out of view (such as process elements and steps to finish the tasks).
Q: What kind of impact does using a dashboard map have on your productivity?
Wojciech: I think the key is to have quick Q&A sessions with your dashboard map. If I need to answer project questions and I have included all of the important information about it in my map, then it’s probably located in the topic enhancements, such as linked maps, attachments and hyperlinks. Using a dashboard map, there are fewer situations where I have to say “I don’t know.” It keeps everything I need at my fingertips.
Q: How does your dashboard help you stay focused on the most important things in your work and life?
Wojciech: Every day I start my work with my dashboard map. It shows me the paths of “hot” projects with tasks and relationships. Using tags (for example, the names of cities), I filter the map to see all tasks connected to that city. If anyone asks, “What is the status of this project?” I can access a set of structured tasks with context information (resources, progress, dates, call outs with comments, linked documents) that contains the answers.
Q: You publish a large number of mind maps and diagrams on Facebook. How have you organized them so they are easy for you to find? Are they linked to your dashboard?
Wojciech: To keep track of my map examples, I create hyperlinks to specific documents and folders with categories in my dashboard map. It’s helpful to prepare “trees” of folders to keep all of them under control.
Q: Is your dashboard a living document? In other words, do you frequently update it with new files and links based on the projects you’re working on?
Wojciech: Yes, I update my dashboard map daily. I change the status of tasks, manage the attachments and hyperlinks of my projects. If there is a new project, I add the structure of it to my dashboard map and add specific documentation and links to key folders to keep everything organized.
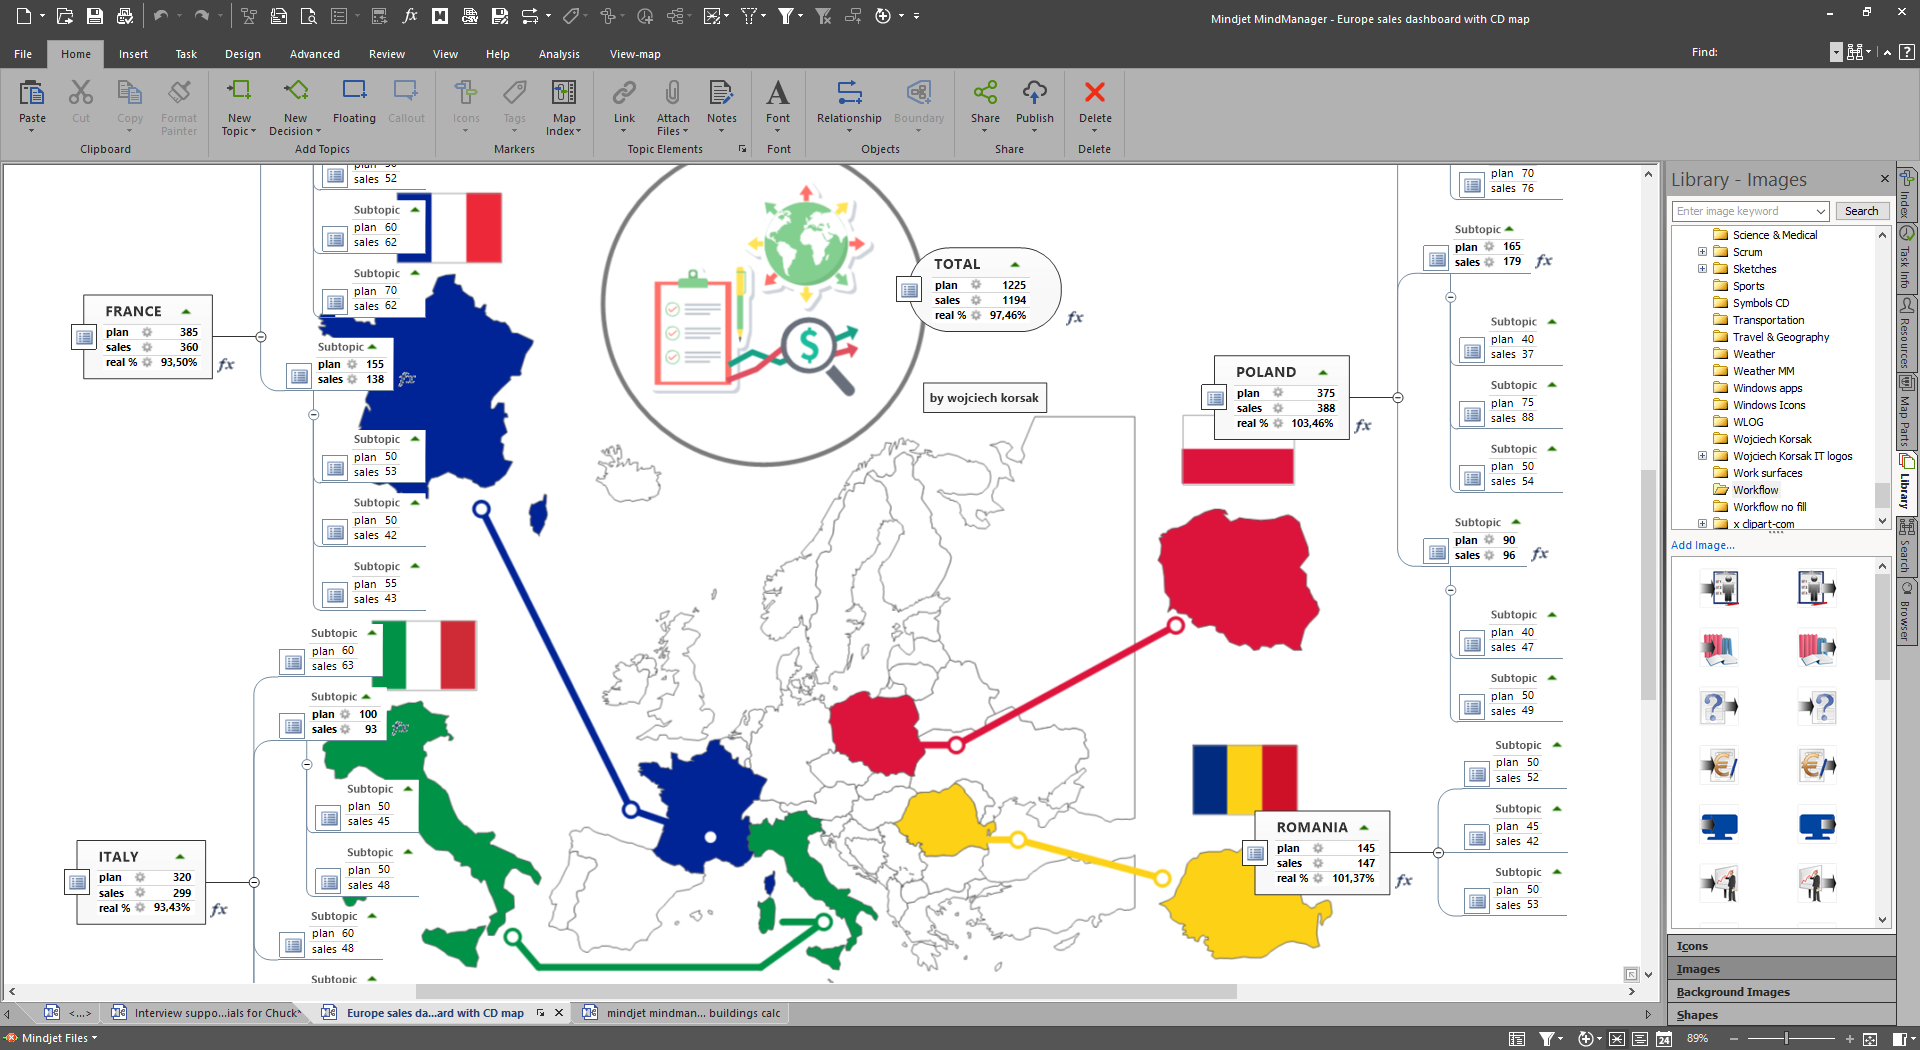
Q: Does your dashboard contain any live data, such as spreadsheet cell ranges?
Wojciech: Yes, I use this option very often. I think it’s very powerful. I manage many Excel spreadsheets, so it’s important to see the key information in my dashboard map. MindManager enables me to link specific Excel cell ranges to my dashboard map – without opening any spreadsheets. I can refresh them in MindManager to pull in the latest data, too, which is nice. If I need to see the source tables, I can open them in Excel and do some analytical work there (for example, pivot tables). The cell sheet ranges in my map are linked to the source file. I also use map roll-ups to see subtopics with spreadsheet cell ranges from other maps. In my opinion, a dashboard map should contain live data wherever possible.
Q: When you consult with clients about mind mapping, how much of the discussion is focused on dashboards?
Wojciech: It depends on the situation. For example, if a client wants to use mind maps to create simple structures or if they want to manage their data in a more comprehensive way. If people are open to new ideas and are ready to try something new – like the idea of dashboard maps – it’s easier to support them in this area. Everyone has their own way to manage their work, so if someone doesn’t want to jump to the dashboard idea, he can just stay with mind mapping as a diagramming tool.
Q: What steps do you recommend to your clients to set up their own dashboards?
Wojciech: I find that it works best if I first draw the structure of the dashboard map using pen and paper. I recommend this approach to my clients, too. It helps me to see all tasks to do in the “real” world and not just in an abstract software environment. It’s great way to envision all of the information sources, such as business partners, types of documents, project teams, etc. Then it’s much easier to create a dashboard with a creative topic tree structure. Seeing the paper model also makes it easier for me to define what kind of information I want to have as topics, links, attachments, spreadsheet cell ranges or internal calculations.
When I invest time in the first creative stage to draw a paper model, I have less situations when I need to ask myself “Where should I put this topic in the map?” At the end of creating my dashboard, I see not only tree of subtopics, but I have in mind the hand-drawn model, so I know its structure. That makes it easier for me to find information “hidden” in the subtopics of collapsed branches.
Q: Do you have any tips you’d like to share about creating an effective dashboard mind map?
Wojciech: I think the most powerful option in MindManager is the roll-up function. If we define tasks (dates, progress, priority and resources, tags, notes), we can see the full paths of tasks that should be done – who, when, where and how. If we manage our work with a dashboard map and open it everyday we can mark our progress so the map is alive. We can add a sync option with Microsoft Outlook elements so it’s a really powerful tool to manage our business with quick overviews.
Q: What practices should people avoid when creating and managing their dashboard mind map?
Wojciech: I think we should invest our time to plan the dashboard. What kind of questions will be placed in it? What kind of information will we need to manage our work? We should plan alerts to put into the map, so MindManager can help us in daily work. If we start creating dashboard in “hurry” mode, we can create a mind map about everything, but it will be hard to use it. If we start to build the structure without a plan, its structure may be OK for today, but it won’t work for tomorrow.
Want to learn how to supercharge your productivity?
 You’re in luck! In his recent webinar, expert project manager Adam Cherrill shared his insights into what he calls “High-Velocity Productivity”. Adam has spent 20+ years in the U.S. aerospace and defense industry in a variety of engineering, business development, programs management and leadership roles.
Join us as we dig into:
- Individual productivity: Mastering personal workflow
- Team productivity: Applying the “Rules in Use” method
- Organizational productivity: Understanding the Theory of Constraints principles
PLUS! Practical tools to help you put these principles into action after the webinar.
If you’re a knowledge professional who thinks for a living and seeks better guidance, navigation, and control of their work, you’ll want to check out this webinar. View the recording now!