By: Emily Finlay
Getting new sales is a delicate process. Your sales team spends hours every day talking to prospects and guiding them through the many steps involved. Sometimes they land the sale and other times they just fall short.
Using a sales funnel chart doesn’t necessarily guarantee more sales, but it can help you organize your processes. With a better way to visualize each stage, you can minimize the number of potential customers you lose to forgetfulness and disorganization.
In this article, we’ll walk you through the different elements of a sales funnel chart, how you can create your own, and the best ways to use it to increase your business. These tips will give you the professional tools and techniques that will help you stand out from your competitors and ensure you never miss another opportunity.
What is a sales funnel chart?
A sales funnel chart is a graphic that represents the sales journey, moving people from leads to customers. Shaped like an upside-down pyramid or a real-life funnel, it starts broad at the top and reaches its narrowest point at the bottom. The visualization is broken into horizontal slices that represent each of the stages in your sales process.
What are the sections of a sales funnel chart?
Since sales funnels follow the business’ sales process, every chart is unique. That said, there are some basic stages that every funnel includes, such as:
- Marketing (top of the funnel) – This section includes anyone that might come in contact with your ads and marketing efforts. Since your promotions will reach a large number of people, most of whom won’t become customers, this section is the largest.
- Sales process (middle of the funnel) – When leads connect with your company after experiencing your marketing, they enter your sales process. The further you get in this process, the fewer people will remain, so this section narrows significantly as it goes.
- Customers (bottom of the funnel) – Anyone who leaves your funnel does so as a customer. If they don’t make a purchase, no matter which stage they stop at, they remain potential leads.
More specifically, there are four general steps to every sales process. Your own procedures likely follow these four stages, so understanding them is critical.
1. Awareness
When someone first becomes aware of a product or business, they become leads or prospects for that company. This usually results from advertising, referrals, Google searches, social media, etc. If the message they encounter shows how you can meet a need, they may move from awareness to the next stage, interest.
2. Interest
Now that they know about you, prospects can now determine if you have the qualities they’re looking for. They might explore your pricing, company, reviews, and other products. Many leads also explore your competitors at this stage. They are interested in you, but they need confirmation before they can make a final decision.
3. Decision
At this point, many people have enough information to decide whether or not they are going to make a purchase. To sway leads, this is the best time to offer promotions, case studies, or information that increases your authority. You can also use the principle of scarcity (it’s a limited time offer!) to urge prospects to make their purchase before they can talk themselves out of it.
4. Action
If the prospect decides to buy, you want to make the purchasing process as easy and comfortable as possible. The faster you can move them through each step, the better the chances are of landing the sale.
If they decide not to buy anything, don’t move on to the next lead. Instead, use the information you’ve gathered to stay in touch. You never know if a phone call, email, or promotion might be the thing that changes their mind.
How to use the sales funnel chart
Once you’ve created your sales funnel chart, you can use it to organize and optimize every step of your sales process. This will help you understand how everything your business does fits into your conversion efforts. Visually breaking down your procedures also shows what is working and where you need to consider trying something new.
Integrate metrics
The best way to know where your sales process is failing is to measure the success of each step. Track the number of people lost or converted for each step, adding these numbers to your chart. Analyze the strategies you use to close leads to see what is and isn’t working. Most importantly, look for the gaps that allow prospects to be forgotten or ignored. Resolving these issues will make an undeniable difference.
Optimize lead generation
How are you marketing to your potential customers? Which channels bring in the most qualified leads? This is the beginning of your sales process, so it’s the only way you can connect to the people who will be most interested in your products. Make sure your marketing budget is working to find the right people, not just the most people.
Improve your sales process
At the end of the day, this is the most important reason to create a sales funnel chart. You’re not only trying to understand the steps your customers take, but how effectively they’re working. In this initial evaluation, consider every minute detail, such as:
- Are we targeting the right audience for marketing?
- Why does this percentage of customers choose a competitor at this stage?
- Is our purchasing process encouraging sales or driving them away?
- Do we need to update our promotional materials to better attract or convince prospective customers?
As you refine this process, you can also determine where your products, not your sales funnel, are to blame for lost business. In time, your sales funnel chart will help your sales team become the best around.
How to create a sales funnel chart
Before you can create your chart, you need to know what it will include. Walking through your sales process beforehand will help you determine what your graphic will look like. Once you have this information, you can design your complete sales funnel chart.
1. Outline your sales steps
Gather your team and talk through your sales process from start to finish. Keep it general at first, ordering every step and effort in the correct sequence. Then refine each option, consolidating where appropriate.
When your list is complete, go through and group every action under the most relevant stage from the four listed above.
2. Create your sales funnel chart
You can create a digital graphic or draw one by hand. If creating a physical chart, use paper, a whiteboard, or poster board. For digital representations, use any data visualization tools, such as MindManager, that allow you to create a custom graphic.
Your chart will start with an inverted triangle. You will be adding all of the steps you outlined in step one, so make it big enough to fit everything. Next, use horizontal lines to break the funnel into the number of segments you need to include your steps. Write each step into the appropriate lining, taking care to keep every item in the right order.
Color-coding each of the four sales stages within your chart can help you keep track of what goes where at a glance. You can also add details about each step so everyone on the team clearly understands what is involved.
3. Update your chart as needed
Sales tactics, technology, and customer trends change constantly. This chart should be a living tool, one that you update regularly with the adjustments you make. We also recommend making copies of your sales funnel to share with your team. With this visual tool, their efforts to move prospects through your process will be more effective.
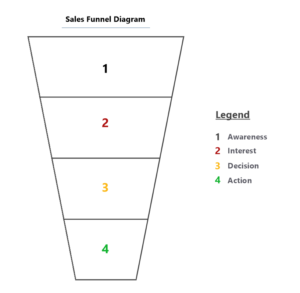
Example of a sales funnel chart
As you can see in the examples below, your chart can be as simple or detailed as you want it to be. Use this funnel as a template or inspiration for your own graphics.

Sales funnel chart use cases
There are many ways you can use a sales funnel chart in your daily business activities.
If, for example, your sales staff can add the number of prospects they lose in each step to their charts. With this visual breakdown, they can then identify their weaknesses and work on creating new tactics in those areas.
When reaching out to potential leads, your sales funnel chart can help you design a multi-step outreach strategy. Using automated emails, for instance, you can create a campaign that nurtures leads over several months. Your funnel’s outline will guide you through the right steps, allowing you to do the work in advance while generating excellent results.
You can also use your chart to evaluate and refine your messaging. This might mean replacing the materials you’ve been using in your marketing. Or, you may need to move your messaging from one step to another. With your sales funnel chart as a guide, you will always know what to do next.
Downloadable sales funnel chart templates from MindManager
Click the image below to access the sales funnel chart example shared above. Click “Menu” in the bottom left corner of your browser window, and then click “Download” to get a copy of the template. Open the template in MindManager to start working.
 Don’t have MindManager? No worries! Try it free for 30 days.